

E1C01 09/14/2010
15:40:35 Page 18
given in Figure 1.10. The voltage output during calibration is compared with the expected values
obtained from reference tables. The trend of the errors can be correlated, as shown by the curve fit.
We see the maximum errors are two orders of magnitude smaller than the measured values, but we
also see that the errors are smallest at either limit of the measuring range. We also see that the error
varies in magnitude. The range over which it varies is the uncertainty in the measurement.
Random and Systematic Errors and Uncertainty
Errors are effects that cause a measured value to differ from its true value. Random error causes a
random variation in measured values found during repeated measurements of a variable. Systematic
error causes an offset between the mean value of the data set and its true value. Both random and
systematic errors affect a system’s accuracy.
The concept of accuracy and the effects of systematic and random errors in instruments
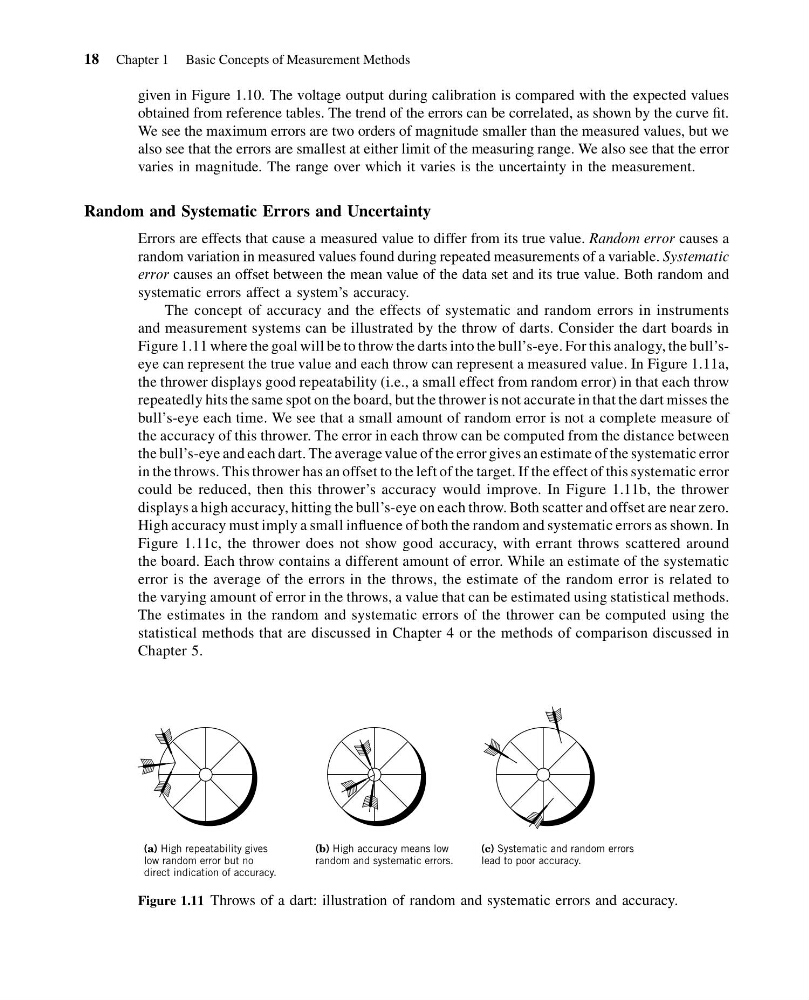
and measurement systems can be illustrated by the throw of darts. Consider the dart boards in
Figure 1.11 where the goal will be to throw the darts into the bull’s-eye. For this analogy, the bull’seye can represent the true value and each throw can represent a measured value. In Figure 1.11a,
the thrower displays good repeatability (i.e., a small effect from random error) in that each throw
repeatedly hits the same spot on the board, but the thrower is not accurate in that the dart misses the
bull’s-eye each time. We see that a small amount of random error is not a complete measure of
the accuracy of this thrower. The error in each throw can be computed from the distance between
the bull’s-eye and each dart. The average value of the error gives an estimate of the systematic error
in the throws. This thrower has an offset to the left of the target. If the effect of this systematic error
could be reduced, then this thrower’s accuracy would improve. In Figure 1.11b, the thrower
displays a high accuracy, hitting the bull’s-eye on each throw. Both scatter and offset are near zero.
High accuracy must imply a small influence of both the random and systematic errors as shown. In
Figure 1.11c, the thrower does not show good accuracy, with errant throws scattered around
the board. Each throw contains a different amount of error. While an estimate of the systematic
error is the average of the errors in the throws, the estimate of the random error is related to
the varying amount of error in the throws, a value that can be estimated using statistical methods.
The estimates in the random and systematic errors of the thrower can be computed using the
statistical methods that are discussed in Chapter 4 or the methods of comparison discussed in
Chapter 5.
(a) High repeatability gives
low random error but no
direct indication of accuracy.
(b) High accuracy means low
random and systematic errors.
(c) Systematic and random errors
lead to poor accuracy.
Figure 1.11 Throws of a dart: illustration of random and systematic errors and accuracy.
18 Chapter 1 Basic Concepts of Measurement Methods
15:40:35 Page 18
given in Figure 1.10. The voltage output during calibration is compared with the expected values
obtained from reference tables. The trend of the errors can be correlated, as shown by the curve fit.
We see the maximum errors are two orders of magnitude smaller than the measured values, but we
also see that the errors are smallest at either limit of the measuring range. We also see that the error
varies in magnitude. The range over which it varies is the uncertainty in the measurement.
Random and Systematic Errors and Uncertainty
Errors are effects that cause a measured value to differ from its true value. Random error causes a
random variation in measured values found during repeated measurements of a variable. Systematic
error causes an offset between the mean value of the data set and its true value. Both random and
systematic errors affect a system’s accuracy.
The concept of accuracy and the effects of systematic and random errors in instruments
and measurement systems can be illustrated by the throw of darts. Consider the dart boards in
Figure 1.11 where the goal will be to throw the darts into the bull’s-eye. For this analogy, the bull’seye can represent the true value and each throw can represent a measured value. In Figure 1.11a,
the thrower displays good repeatability (i.e., a small effect from random error) in that each throw
repeatedly hits the same spot on the board, but the thrower is not accurate in that the dart misses the
bull’s-eye each time. We see that a small amount of random error is not a complete measure of
the accuracy of this thrower. The error in each throw can be computed from the distance between
the bull’s-eye and each dart. The average value of the error gives an estimate of the systematic error
in the throws. This thrower has an offset to the left of the target. If the effect of this systematic error
could be reduced, then this thrower’s accuracy would improve. In Figure 1.11b, the thrower
displays a high accuracy, hitting the bull’s-eye on each throw. Both scatter and offset are near zero.
High accuracy must imply a small influence of both the random and systematic errors as shown. In
Figure 1.11c, the thrower does not show good accuracy, with errant throws scattered around
the board. Each throw contains a different amount of error. While an estimate of the systematic
error is the average of the errors in the throws, the estimate of the random error is related to
the varying amount of error in the throws, a value that can be estimated using statistical methods.
The estimates in the random and systematic errors of the thrower can be computed using the
statistical methods that are discussed in Chapter 4 or the methods of comparison discussed in
Chapter 5.
(a) High repeatability gives
low random error but no
direct indication of accuracy.
(b) High accuracy means low
random and systematic errors.
(c) Systematic and random errors
lead to poor accuracy.
Figure 1.11 Throws of a dart: illustration of random and systematic errors and accuracy.
18 Chapter 1 Basic Concepts of Measurement Methods