

E1C01 09/14/2010
15:40:35 Page 17
Accuracy and Error
The exact value of a variable is called the true value. The value of the variables as indicated by a
measurement system is called the measured value. The accuracy of a measurement refers to the
closeness of agreement between the measured value and the true value. But the true value is rarely
known exactly, and various influences, called errors, have an effect on both of these values. So the
concept of the accuracy of a measurement is a qualitative one.
An appropriate approach to stating this closeness of agreement is to identify the measurement
errors and to quantify them by the value of their associated uncertainties, where an uncertainty is the
estimated range of value of an error. We define an error, e, as the difference between the measured
value and the true value, that is
e ¼ Measured value À True value
ð1:4Þ
While the true value is rarely known exactly, Equation 1.4 serves as a reference definition.
Errors exist and they have a magnitude as given by Equation 1.4. The concept is something we
discuss next and then develop extensively in Chapter 5.
Often an estimate for the value of error is based on a reference value used during the
instrument’s calibration as a surrogate for the true value. A relative error based on this reference
value is estimated by
A ¼
jej
Reference value
 100
ð1:5Þ
A few vendors may still refer to this term as the ‘‘relative accuracy.’’
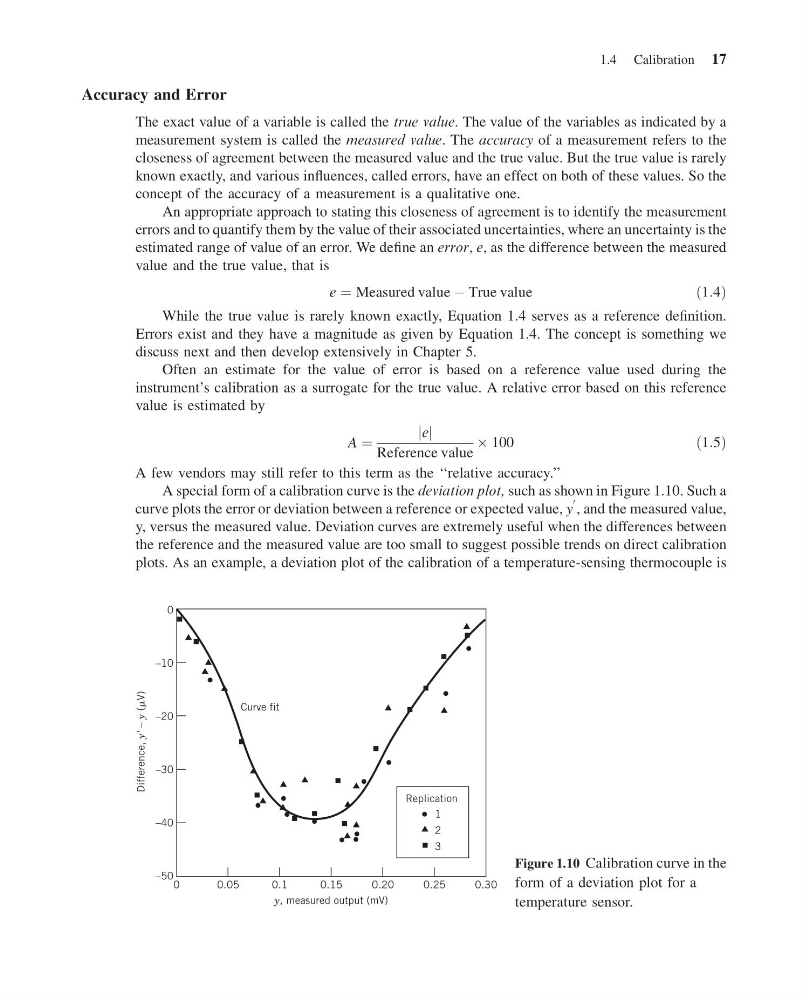
A special form of a calibration curve is the deviation plot, such as shown in Figure 1.10. Such a
curve plots the error or deviation between a reference or expected value, y
0 , and the measured value,
y, versus the measured value. Deviation curves are extremely useful when the differences between
the reference and the measured value are too small to suggest possible trends on direct calibration
plots. As an example, a deviation plot of the calibration of a temperature-sensing thermocouple is
0
1
2
3
0.15
0.1
0.05
y, measured output (mV)
0.20
Replication
Curve fit
Difference,
y' –
y ( V)
0.30
0.25
–50
–40
–30
–20
–10
0
Figure 1.10 Calibration curve in the
form of a deviation plot for a
temperature sensor.
1.4 Calibration 17
15:40:35 Page 17
Accuracy and Error
The exact value of a variable is called the true value. The value of the variables as indicated by a
measurement system is called the measured value. The accuracy of a measurement refers to the
closeness of agreement between the measured value and the true value. But the true value is rarely
known exactly, and various influences, called errors, have an effect on both of these values. So the
concept of the accuracy of a measurement is a qualitative one.
An appropriate approach to stating this closeness of agreement is to identify the measurement
errors and to quantify them by the value of their associated uncertainties, where an uncertainty is the
estimated range of value of an error. We define an error, e, as the difference between the measured
value and the true value, that is
e ¼ Measured value À True value
ð1:4Þ
While the true value is rarely known exactly, Equation 1.4 serves as a reference definition.
Errors exist and they have a magnitude as given by Equation 1.4. The concept is something we
discuss next and then develop extensively in Chapter 5.
Often an estimate for the value of error is based on a reference value used during the
instrument’s calibration as a surrogate for the true value. A relative error based on this reference
value is estimated by
A ¼
jej
Reference value
 100
ð1:5Þ
A few vendors may still refer to this term as the ‘‘relative accuracy.’’
A special form of a calibration curve is the deviation plot, such as shown in Figure 1.10. Such a
curve plots the error or deviation between a reference or expected value, y
0 , and the measured value,
y, versus the measured value. Deviation curves are extremely useful when the differences between
the reference and the measured value are too small to suggest possible trends on direct calibration
plots. As an example, a deviation plot of the calibration of a temperature-sensing thermocouple is
0
1
2
3
0.15
0.1
0.05
y, measured output (mV)
0.20
Replication
Curve fit
Difference,
y' –
y ( V)
0.30
0.25
–50
–40
–30
–20
–10
0
Figure 1.10 Calibration curve in the
form of a deviation plot for a
temperature sensor.
1.4 Calibration 17