

E1C06 09/14/2010
11:55:8 Page 256
where R g is the internal resistance of a galvanometer. The null condition of the galvanometer may be
assumed to have negligible error. The uncertainty associated with R x is associated with the reading
obtained from the location of the sliding contact. Estimate the uncertainty in the measured value of
voltage at nominal values of 2 and 8 V.
6.13 The temperature sensor of Example 6.2 is connected to a Wheatstone bridge using R 3 ¼ R 4 ¼ 100 V.
The sensor is immersed into boiling water at 1 atm abs. pressure. What is the resistance of balancing
resistor R 2 to balance the bridge? R sensor ð0
CÞ ¼ 100 V
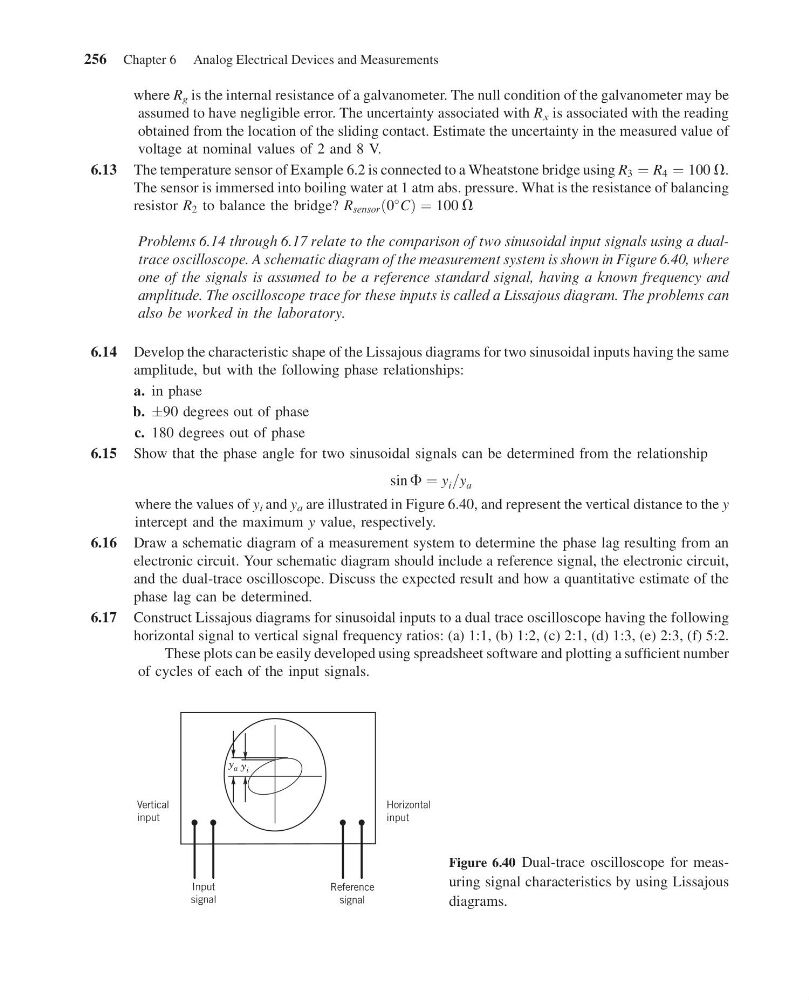
Problems 6.14 through 6.17 relate to the comparison of two sinusoidal input signals using a dualtrace oscilloscope. A schematic diagram of the measurement system is shown in Figure 6.40, where
one of the signals is assumed to be a reference standard signal, having a known frequency and
amplitude. The oscilloscope trace for these inputs is called a Lissajous diagram. The problems can
also be worked in the laboratory.
6.14 Develop the characteristic shape of the Lissajous diagrams for two sinusoidal inputs having the same
amplitude, but with the following phase relationships:
a. in phase
b. Æ90 degrees out of phase
c. 180 degrees out of phase
6.15 Show that the phase angle for two sinusoidal signals can be determined from the relationship
sin F ¼ y i =y a
where the values of y i and y a are illustrated in Figure 6.40, and represent the vertical distance to the y
intercept and the maximum y value, respectively.
6.16 Draw a schematic diagram of a measurement system to determine the phase lag resulting from an
electronic circuit. Your schematic diagram should include a reference signal, the electronic circuit,
and the dual-trace oscilloscope. Discuss the expected result and how a quantitative estimate of the
phase lag can be determined.
6.17 Construct Lissajous diagrams for sinusoidal inputs to a dual trace oscilloscope having the following
horizontal signal to vertical signal frequency ratios: (a) 1:1, (b) 1:2, (c) 2:1, (d) 1:3, (e) 2:3, (f) 5:2.
These plots can be easily developed using spreadsheet software and plotting a sufficient number
of cycles of each of the input signals.
Vertical
input
Input
signal
Horizontal
input
Reference
signal
y a y i
Figure 6.40 Dual-trace oscilloscope for measuring signal characteristics by using Lissajous
diagrams.
256 Chapter 6 Analog Electrical Devices and Measurements
11:55:8 Page 256
where R g is the internal resistance of a galvanometer. The null condition of the galvanometer may be
assumed to have negligible error. The uncertainty associated with R x is associated with the reading
obtained from the location of the sliding contact. Estimate the uncertainty in the measured value of
voltage at nominal values of 2 and 8 V.
6.13 The temperature sensor of Example 6.2 is connected to a Wheatstone bridge using R 3 ¼ R 4 ¼ 100 V.
The sensor is immersed into boiling water at 1 atm abs. pressure. What is the resistance of balancing
resistor R 2 to balance the bridge? R sensor ð0
CÞ ¼ 100 V
Problems 6.14 through 6.17 relate to the comparison of two sinusoidal input signals using a dualtrace oscilloscope. A schematic diagram of the measurement system is shown in Figure 6.40, where
one of the signals is assumed to be a reference standard signal, having a known frequency and
amplitude. The oscilloscope trace for these inputs is called a Lissajous diagram. The problems can
also be worked in the laboratory.
6.14 Develop the characteristic shape of the Lissajous diagrams for two sinusoidal inputs having the same
amplitude, but with the following phase relationships:
a. in phase
b. Æ90 degrees out of phase
c. 180 degrees out of phase
6.15 Show that the phase angle for two sinusoidal signals can be determined from the relationship
sin F ¼ y i =y a
where the values of y i and y a are illustrated in Figure 6.40, and represent the vertical distance to the y
intercept and the maximum y value, respectively.
6.16 Draw a schematic diagram of a measurement system to determine the phase lag resulting from an
electronic circuit. Your schematic diagram should include a reference signal, the electronic circuit,
and the dual-trace oscilloscope. Discuss the expected result and how a quantitative estimate of the
phase lag can be determined.
6.17 Construct Lissajous diagrams for sinusoidal inputs to a dual trace oscilloscope having the following
horizontal signal to vertical signal frequency ratios: (a) 1:1, (b) 1:2, (c) 2:1, (d) 1:3, (e) 2:3, (f) 5:2.
These plots can be easily developed using spreadsheet software and plotting a sufficient number
of cycles of each of the input signals.
Vertical
input
Input
signal
Horizontal
input
Reference
signal
y a y i
Figure 6.40 Dual-trace oscilloscope for measuring signal characteristics by using Lissajous
diagrams.
256 Chapter 6 Analog Electrical Devices and Measurements