

E1C06 09/14/2010
11:55:9 Page 257
6.18 As a data acquisition anti-alias filter, an RC Butterworth filter is designed with a cutoff frequency of
100 Hz using a single-stage topology. Determine the attenuation of the filtered analog signal at 10,
50, 75, and 200 Hz.
6.19 A three-stage LC Bessel filter with f c ¼ 100 Hz is used to filter an analog signal. Determine the
attenuation of the filtered analog signal at 10, 50, 75, and 200 Hz.
6.20 Design a cascading LC low-pass filter with maximally flat magnitude response. Use a passband of 0
to 5 kHz with 5 kHz cutoff frequency and filter to attenuate all frequencies at and above 10 kHz by at
least 30 dB. Use R s ¼ R L ¼ 50 V.
6.21 An electrical displacement transducer has an output impedance of Z ¼ 500 V. Its voltage is input to a
voltage measuring device that has an input impedance of Z ¼ 100 kV. Estimate the ratio of true
voltage to the voltage measured by the measuring device.
6.22 Consider a transducer connected to a voltage measuring device. Plot the ratio E m /E 1 as the ratio of
output impedance of the transducer to input impedance of the measuring device varies from 1:1 to
1:10,000 (just look at each order of magnitude). Comment on the effect that input impedance has on
measuring a voltage. What value of input impedance would be acceptable in a quality instrument?
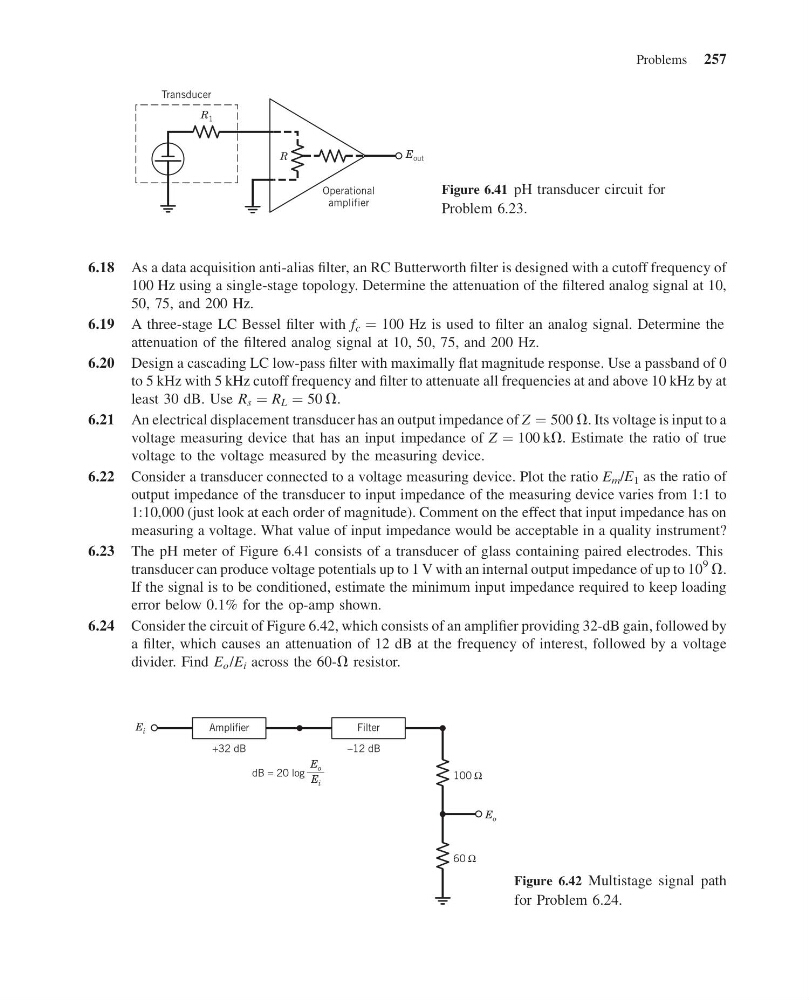
6.23 The pH meter of Figure 6.41 consists of a transducer of glass containing paired electrodes. This
transducer can produce voltage potentials up to 1 V with an internal output impedance of up to 10
9
V.
If the signal is to be conditioned, estimate the minimum input impedance required to keep loading
error below 0.1% for the op-amp shown.
6.24 Consider the circuit of Figure 6.42, which consists of an amplifier providing 32-dB gain, followed by
a filter, which causes an attenuation of 12 dB at the frequency of interest, followed by a voltage
divider. Find E o /E i across the 60-V resistor.
Transducer
Operational
amplifier
R 1
E out
R
Figure 6.41 pH transducer circuit for
Problem 6.23.
Amplifier
Filter
100 Ω
60 Ω
E o
E i
–12 dB
dB = 20 log
E o
E i
+32 dB
Figure 6.42 Multistage signal path
for Problem 6.24.
Problems 257
11:55:9 Page 257
6.18 As a data acquisition anti-alias filter, an RC Butterworth filter is designed with a cutoff frequency of
100 Hz using a single-stage topology. Determine the attenuation of the filtered analog signal at 10,
50, 75, and 200 Hz.
6.19 A three-stage LC Bessel filter with f c ¼ 100 Hz is used to filter an analog signal. Determine the
attenuation of the filtered analog signal at 10, 50, 75, and 200 Hz.
6.20 Design a cascading LC low-pass filter with maximally flat magnitude response. Use a passband of 0
to 5 kHz with 5 kHz cutoff frequency and filter to attenuate all frequencies at and above 10 kHz by at
least 30 dB. Use R s ¼ R L ¼ 50 V.
6.21 An electrical displacement transducer has an output impedance of Z ¼ 500 V. Its voltage is input to a
voltage measuring device that has an input impedance of Z ¼ 100 kV. Estimate the ratio of true
voltage to the voltage measured by the measuring device.
6.22 Consider a transducer connected to a voltage measuring device. Plot the ratio E m /E 1 as the ratio of
output impedance of the transducer to input impedance of the measuring device varies from 1:1 to
1:10,000 (just look at each order of magnitude). Comment on the effect that input impedance has on
measuring a voltage. What value of input impedance would be acceptable in a quality instrument?
6.23 The pH meter of Figure 6.41 consists of a transducer of glass containing paired electrodes. This
transducer can produce voltage potentials up to 1 V with an internal output impedance of up to 10
9
V.
If the signal is to be conditioned, estimate the minimum input impedance required to keep loading
error below 0.1% for the op-amp shown.
6.24 Consider the circuit of Figure 6.42, which consists of an amplifier providing 32-dB gain, followed by
a filter, which causes an attenuation of 12 dB at the frequency of interest, followed by a voltage
divider. Find E o /E i across the 60-V resistor.
Transducer
Operational
amplifier
R 1
E out
R
Figure 6.41 pH transducer circuit for
Problem 6.23.
Amplifier
Filter
100 Ω
60 Ω
E o
E i
–12 dB
dB = 20 log
E o
E i
+32 dB
Figure 6.42 Multistage signal path
for Problem 6.24.
Problems 257