

E1C06 09/14/2010
11:55:6 Page 244
then the table values assigned to C and L switch. The values in Table 6.1 are normalized with R s ¼ R L ¼
1 V and v c ¼ 2pf c ¼ 1 rad/s. For other values, L i and C i are scaled by
L ¼ L i R=2pf c
ð6:61aÞ
C ¼ C i = R2pf c
ð
Þ
ð6:61bÞ
When R L 6 ¼ R S the impedances can be properly scaled but the reader is referred to published scaling
tables, such as given in reference 8. Butterworth filters are quite common and are found in
consumer products such as audio equipment. With their flat passband, they are commonly chosen as
anti-aliasing filters for data acquisition systems.
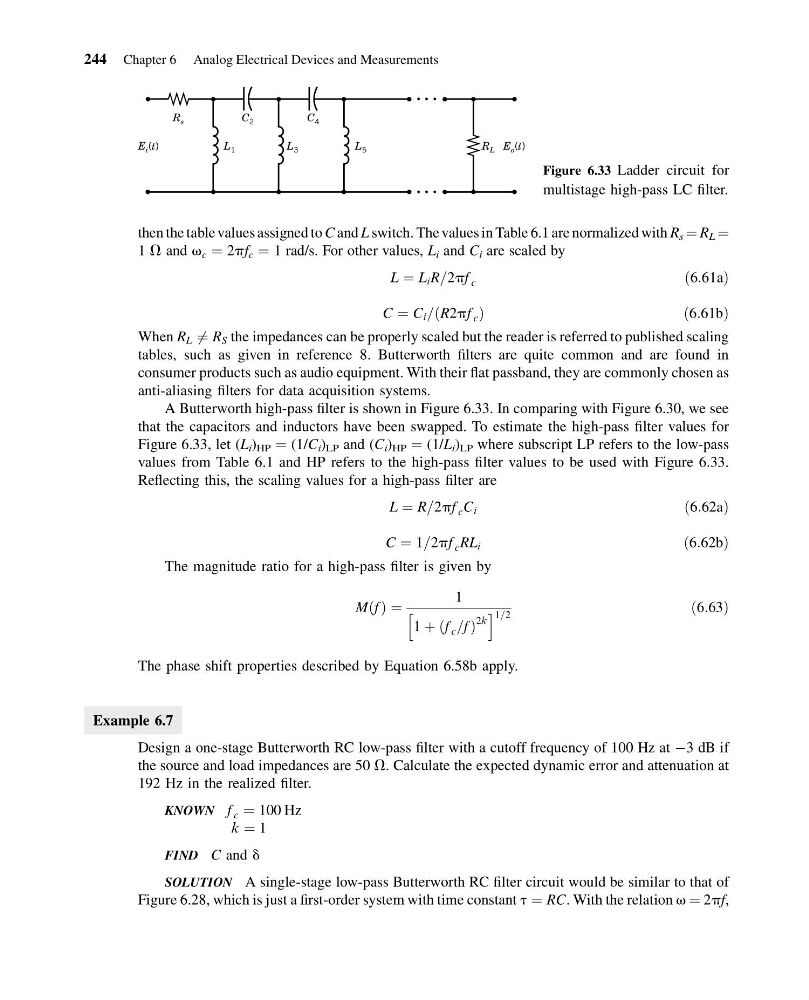
A Butterworth high-pass filter is shown in Figure 6.33. In comparing with Figure 6.30, we see
that the capacitors and inductors have been swapped. To estimate the high-pass filter values for
Figure 6.33, let (L i ) HP ¼ (1/C i ) LP and (C i ) HP ¼ (1/L i ) LP where subscript LP refers to the low-pass
values from Table 6.1 and HP refers to the high-pass filter values to be used with Figure 6.33.
Reflecting this, the scaling values for a high-pass filter are
L ¼ R=2pf c C i
ð6:62aÞ
C ¼ 1=2pf c RL i
ð6:62bÞ
The magnitude ratio for a high-pass filter is given by
M f
ð Þ ¼
1
1 þ f c =f
ð
Þ
2k
h
i 1=2
ð6:63Þ
The phase shift properties described by Equation 6.58b apply.
Example 6.7
Design a one-stage Butterworth RC low-pass filter with a cutoff frequency of 100 Hz at À3 dB if
the source and load impedances are 50 V. Calculate the expected dynamic error and attenuation at
192 Hz in the realized filter.
KNOWN f c ¼ 100 Hz
k ¼ 1
FIND C and d
SOLUTION A single-stage low-pass Butterworth RC filter circuit would be similar to that of
Figure 6.28, which is just a first-order system with time constant t ¼ RC. With the relation v ¼ 2pf,
R L
R s
L 5
L 3
L 1
C 2
C 4
E i (t)
E o (t)
Figure 6.33 Ladder circuit for
multistage high-pass LC filter.
244 Chapter 6 Analog Electrical Devices and Measurements
11:55:6 Page 244
then the table values assigned to C and L switch. The values in Table 6.1 are normalized with R s ¼ R L ¼
1 V and v c ¼ 2pf c ¼ 1 rad/s. For other values, L i and C i are scaled by
L ¼ L i R=2pf c
ð6:61aÞ
C ¼ C i = R2pf c
ð
Þ
ð6:61bÞ
When R L 6 ¼ R S the impedances can be properly scaled but the reader is referred to published scaling
tables, such as given in reference 8. Butterworth filters are quite common and are found in
consumer products such as audio equipment. With their flat passband, they are commonly chosen as
anti-aliasing filters for data acquisition systems.
A Butterworth high-pass filter is shown in Figure 6.33. In comparing with Figure 6.30, we see
that the capacitors and inductors have been swapped. To estimate the high-pass filter values for
Figure 6.33, let (L i ) HP ¼ (1/C i ) LP and (C i ) HP ¼ (1/L i ) LP where subscript LP refers to the low-pass
values from Table 6.1 and HP refers to the high-pass filter values to be used with Figure 6.33.
Reflecting this, the scaling values for a high-pass filter are
L ¼ R=2pf c C i
ð6:62aÞ
C ¼ 1=2pf c RL i
ð6:62bÞ
The magnitude ratio for a high-pass filter is given by
M f
ð Þ ¼
1
1 þ f c =f
ð
Þ
2k
h
i 1=2
ð6:63Þ
The phase shift properties described by Equation 6.58b apply.
Example 6.7
Design a one-stage Butterworth RC low-pass filter with a cutoff frequency of 100 Hz at À3 dB if
the source and load impedances are 50 V. Calculate the expected dynamic error and attenuation at
192 Hz in the realized filter.
KNOWN f c ¼ 100 Hz
k ¼ 1
FIND C and d
SOLUTION A single-stage low-pass Butterworth RC filter circuit would be similar to that of
Figure 6.28, which is just a first-order system with time constant t ¼ RC. With the relation v ¼ 2pf,
R L
R s
L 5
L 3
L 1
C 2
C 4
E i (t)
E o (t)
Figure 6.33 Ladder circuit for
multistage high-pass LC filter.
244 Chapter 6 Analog Electrical Devices and Measurements