

E1C05 09/14/2010
14:36:27 Page 182
to flow rate intrinsic to the time required to divert the liquid to and from the catch tank. If operator
influence is a factor, it should be randomized in actual tests. Accordingly, the above calculations
may be used as a guide in procedure selection.
Example 5.7
Repeat Example 5.6, using sequential perturbation for the operating conditions 8 ¼ 1 ft
3 and t ¼ 6 s.
SOLUTION The operating point is R o ¼ Q ¼ 8=t ¼ 0:1667 ft
3 /s. Then, solving Equations
5.16 to 5.18 gives:
i
x i
R
þ
i
R
À
i
dR
þ
i
dR
þ
i
dR i
1
8
0.1668
0.1665
0.000167
À0.000167
0.000167
2
t
0.1626
0.1709
À0.00407
0.00423
0.00415
Applying Equation 5.19 gives the uncertainty about this operating point
u Q ¼ 0:00415
2
þ 0:000167
2
Â
à 1=2 ¼ Æ4:15  10
À3 ft
3 /s 95%
ð
Þ
or
u Q =Q ¼ Æ0:025 95%
ð
Þ
COMMENT These last two examples give similar results for the uncertainty aside from
insignificant differences due to round-off in the computations.
5.8 MULTIPLE-MEASUREMENT UNCERTAINTY ANALYSIS
This section develops a method for estimating the uncertainty in the value assigned to a variable
based on a set of measurements obtained under fixed operating conditions. The method parallels the
uncertainty standards approved by professional societies and by NIST in the United States (2, 7)
100
10
1
0
Flow rate, Q (ft
3
/min)
Relative uncertainty,
u
Q
/ Q
0.01
Method 1
Method 2
0.0
0.1
0.5
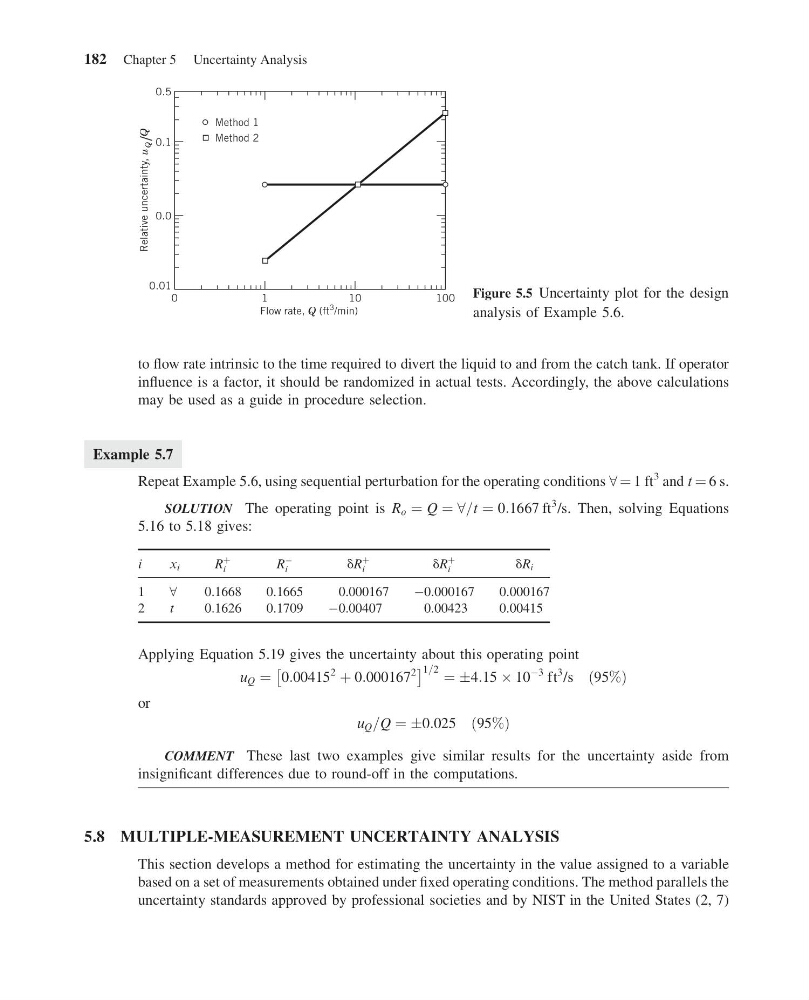
Figure 5.5 Uncertainty plot for the design
analysis of Example 5.6.
182 Chapter 5 Uncertainty Analysis
14:36:27 Page 182
to flow rate intrinsic to the time required to divert the liquid to and from the catch tank. If operator
influence is a factor, it should be randomized in actual tests. Accordingly, the above calculations
may be used as a guide in procedure selection.
Example 5.7
Repeat Example 5.6, using sequential perturbation for the operating conditions 8 ¼ 1 ft
3 and t ¼ 6 s.
SOLUTION The operating point is R o ¼ Q ¼ 8=t ¼ 0:1667 ft
3 /s. Then, solving Equations
5.16 to 5.18 gives:
i
x i
R
þ
i
R
À
i
dR
þ
i
dR
þ
i
dR i
1
8
0.1668
0.1665
0.000167
À0.000167
0.000167
2
t
0.1626
0.1709
À0.00407
0.00423
0.00415
Applying Equation 5.19 gives the uncertainty about this operating point
u Q ¼ 0:00415
2
þ 0:000167
2
Â
à 1=2 ¼ Æ4:15  10
À3 ft
3 /s 95%
ð
Þ
or
u Q =Q ¼ Æ0:025 95%
ð
Þ
COMMENT These last two examples give similar results for the uncertainty aside from
insignificant differences due to round-off in the computations.
5.8 MULTIPLE-MEASUREMENT UNCERTAINTY ANALYSIS
This section develops a method for estimating the uncertainty in the value assigned to a variable
based on a set of measurements obtained under fixed operating conditions. The method parallels the
uncertainty standards approved by professional societies and by NIST in the United States (2, 7)
100
10
1
0
Flow rate, Q (ft
3
/min)
Relative uncertainty,
u
Q
/ Q
0.01
Method 1
Method 2
0.0
0.1
0.5
Figure 5.5 Uncertainty plot for the design
analysis of Example 5.6.
182 Chapter 5 Uncertainty Analysis