

E1C05 09/14/2010
14:36:26 Page 173
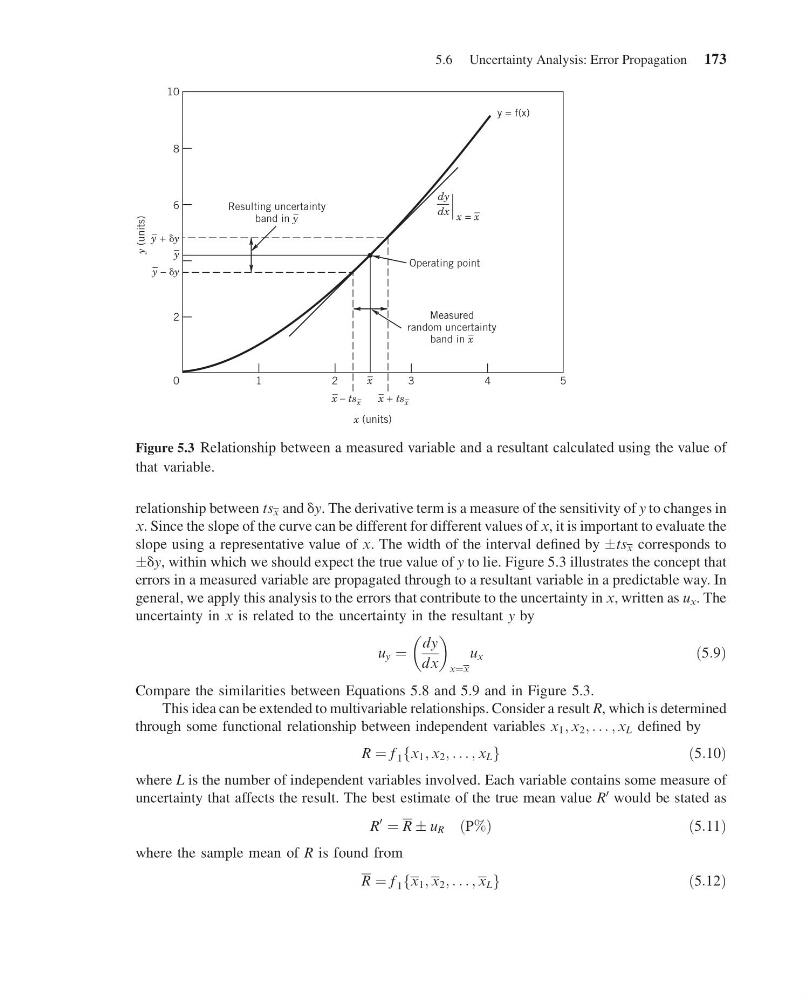
relationship between ts x and dy. The derivative term is a measure of the sensitivity of y to changes in
x. Since the slope of the curve can be different for different values of x, it is important to evaluate the
slope using a representative value of x. The width of the interval defined by Æts x corresponds to
Ædy, within which we should expect the true value of y to lie. Figure 5.3 illustrates the concept that
errors in a measured variable are propagated through to a resultant variable in a predictable way. In
general, we apply this analysis to the errors that contribute to the uncertainty in x, written as u x . The
uncertainty in x is related to the uncertainty in the resultant y by
u y ¼
dy
dx
x¼x
u x
ð5:9Þ
Compare the similarities between Equations 5.8 and 5.9 and in Figure 5.3.
This idea can be extended to multivariable relationships. Consider a result R, which is determined
through some functional relationship between independent variables x 1 ; x 2 ; . . . ; x L defined by
R ¼ f 1 x 1 ; x 2 ; . . . ; x L
f
g
ð5:10Þ
where L is the number of independent variables involved. Each variable contains some measure of
uncertainty that affects the result. The best estimate of the true mean value R
0 would be stated as
R
0
¼ R Æ u R P%
ð Þ
ð5:11Þ
where the sample mean of R is found from
R ¼ f 1 x 1 ; x 2 ; . . . ; x L
f
g
ð5:12Þ
Resulting uncertainty
dy
y = f(x)
dx
band in y –
–
y + y
x – ts x
–
y – y
–
y
–
x –
2
1
0
Operating point
5
4
3
x (units)
y (units)
2
6
8
10
–
–
x + ts x
–
–
x = x
Measured
random uncertainty
–
band in x
Figure 5.3 Relationship between a measured variable and a resultant calculated using the value of
that variable.
5.6 Uncertainty Analysis: Error Propagation 173
14:36:26 Page 173
relationship between ts x and dy. The derivative term is a measure of the sensitivity of y to changes in
x. Since the slope of the curve can be different for different values of x, it is important to evaluate the
slope using a representative value of x. The width of the interval defined by Æts x corresponds to
Ædy, within which we should expect the true value of y to lie. Figure 5.3 illustrates the concept that
errors in a measured variable are propagated through to a resultant variable in a predictable way. In
general, we apply this analysis to the errors that contribute to the uncertainty in x, written as u x . The
uncertainty in x is related to the uncertainty in the resultant y by
u y ¼
dy
dx
x¼x
u x
ð5:9Þ
Compare the similarities between Equations 5.8 and 5.9 and in Figure 5.3.
This idea can be extended to multivariable relationships. Consider a result R, which is determined
through some functional relationship between independent variables x 1 ; x 2 ; . . . ; x L defined by
R ¼ f 1 x 1 ; x 2 ; . . . ; x L
f
g
ð5:10Þ
where L is the number of independent variables involved. Each variable contains some measure of
uncertainty that affects the result. The best estimate of the true mean value R
0 would be stated as
R
0
¼ R Æ u R P%
ð Þ
ð5:11Þ
where the sample mean of R is found from
R ¼ f 1 x 1 ; x 2 ; . . . ; x L
f
g
ð5:12Þ
Resulting uncertainty
dy
y = f(x)
dx
band in y –
–
y + y
x – ts x
–
y – y
–
y
–
x –
2
1
0
Operating point
5
4
3
x (units)
y (units)
2
6
8
10
–
–
x + ts x
–
–
x = x
Measured
random uncertainty
–
band in x
Figure 5.3 Relationship between a measured variable and a resultant calculated using the value of
that variable.
5.6 Uncertainty Analysis: Error Propagation 173