

552
10 Quantum Statistics
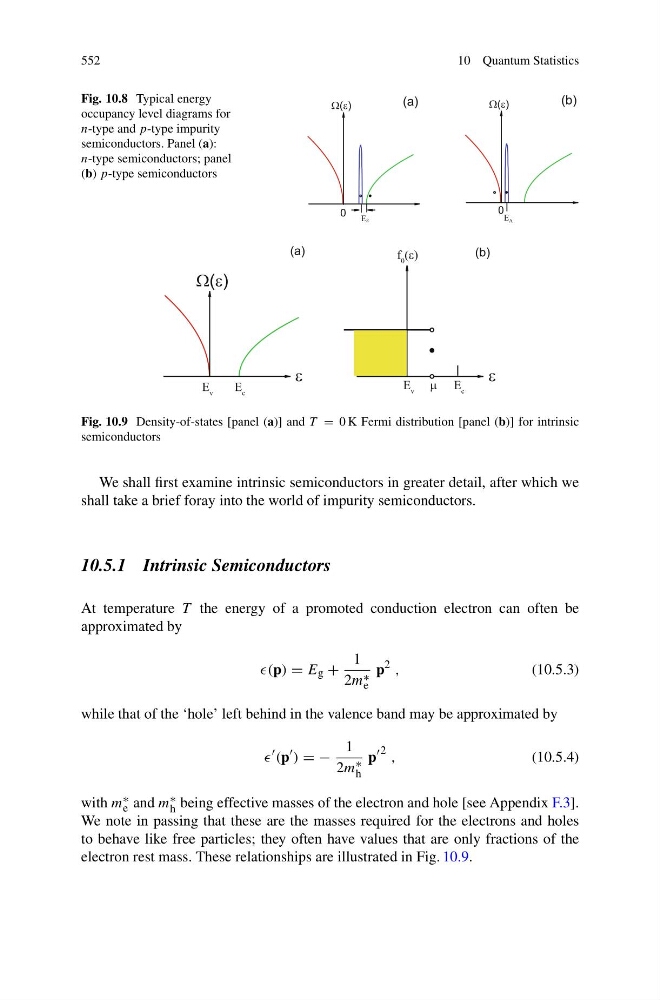
Fig. 10.8 Typical energy
occupancy level diagrams for
n-type and p-type impurity
semiconductors. Panel (a):
n-type semiconductors; panel
(b) p-type semiconductors
0
E A
Ω(ε)
(b)
0 Eg
Ω(ε)
(a)
Ω(ε)
ε
E v
E c
(a)
ε
(b)
f 0 (ε)
E v μ E c
Fig. 10.9 Density-of-states [panel (a)] and T = 0 K Fermi distribution [panel (b)] for intrinsic
semiconductors
We shall first examine intrinsic semiconductors in greater detail, after which we
shall take a brief foray into the world of impurity semiconductors.
10.5.1 Intrinsic Semiconductors
At temperature T the energy of a promoted conduction electron can often be
approximated by
(p) = E g +
1
2m ∗
e
p
2 ,
(10.5.3)
while that of the ‘hole’ left behind in the valence band may be approximated by
(p
) = −
1
2m ∗
h
p
2 ,
(10.5.4)
with m ∗
e and m ∗
h being effective masses of the electron and hole [see Appendix F.3].
We note in passing that these are the masses required for the electrons and holes
to behave like free particles; they often have values that are only fractions of the
electron rest mass. These relationships are illustrated in Fig. 10.9.
10 Quantum Statistics
Fig. 10.8 Typical energy
occupancy level diagrams for
n-type and p-type impurity
semiconductors. Panel (a):
n-type semiconductors; panel
(b) p-type semiconductors
0
E A
Ω(ε)
(b)
0 Eg
Ω(ε)
(a)
Ω(ε)
ε
E v
E c
(a)
ε
(b)
f 0 (ε)
E v μ E c
Fig. 10.9 Density-of-states [panel (a)] and T = 0 K Fermi distribution [panel (b)] for intrinsic
semiconductors
We shall first examine intrinsic semiconductors in greater detail, after which we
shall take a brief foray into the world of impurity semiconductors.
10.5.1 Intrinsic Semiconductors
At temperature T the energy of a promoted conduction electron can often be
approximated by
(p) = E g +
1
2m ∗
e
p
2 ,
(10.5.3)
while that of the ‘hole’ left behind in the valence band may be approximated by
(p
) = −
1
2m ∗
h
p
2 ,
(10.5.4)
with m ∗
e and m ∗
h being effective masses of the electron and hole [see Appendix F.3].
We note in passing that these are the masses required for the electrons and holes
to behave like free particles; they often have values that are only fractions of the
electron rest mass. These relationships are illustrated in Fig. 10.9.