

328
6 Molecular Systems
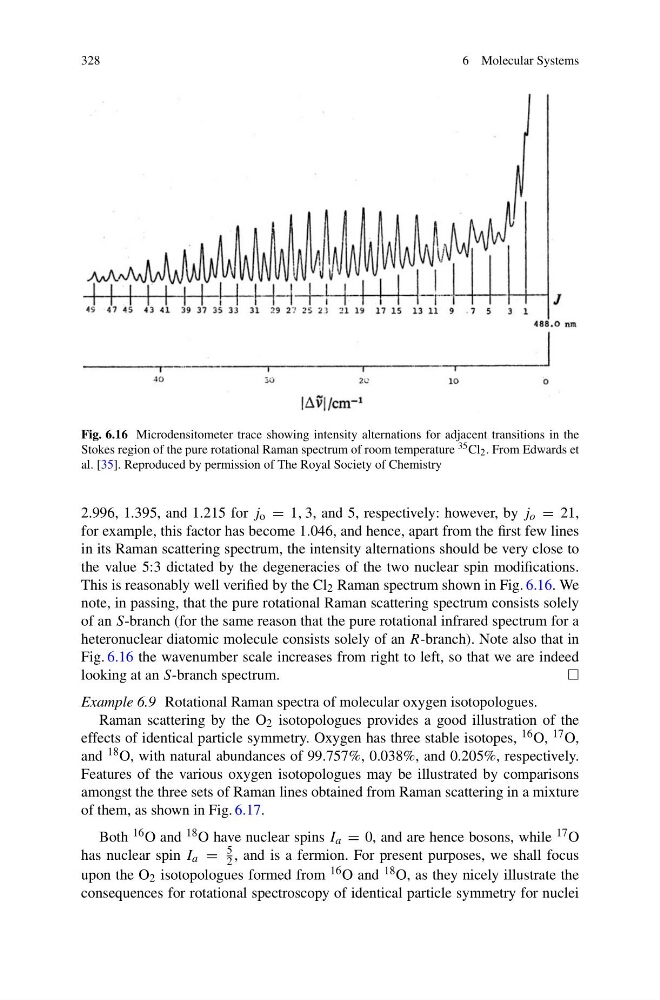
Fig. 6.16 Microdensitometer trace showing intensity alternations for adjacent transitions in the
Stokes region of the pure rotational Raman spectrum of room temperature 35 Cl 2 . From Edwards et
al. [35]. Reproduced by permission of The Royal Society of Chemistry
2.996, 1.395, and 1.215 for j o = 1, 3, and 5, respectively: however, by j o = 21,
for example, this factor has become 1.046, and hence, apart from the first few lines
in its Raman scattering spectrum, the intensity alternations should be very close to
the value 5:3 dictated by the degeneracies of the two nuclear spin modifications.
This is reasonably well verified by the Cl 2 Raman spectrum shown in Fig. 6.16. We
note, in passing, that the pure rotational Raman scattering spectrum consists solely
of an S-branch (for the same reason that the pure rotational infrared spectrum for a
heteronuclear diatomic molecule consists solely of an R-branch). Note also that in
Fig. 6.16 the wavenumber scale increases from right to left, so that we are indeed
looking at an S-branch spectrum.
Example 6.9 Rotational Raman spectra of molecular oxygen isotopologues.
Raman scattering by the O 2 isotopologues provides a good illustration of the
effects of identical particle symmetry. Oxygen has three stable isotopes, 16 O, 17 O,
and 18 O, with natural abundances of 99.757%, 0.038%, and 0.205%, respectively.
Features of the various oxygen isotopologues may be illustrated by comparisons
amongst the three sets of Raman lines obtained from Raman scattering in a mixture
of them, as shown in Fig. 6.17.
Both 16 O and 18 O have nuclear spins I a = 0, and are hence bosons, while 17 O
has nuclear spin I a =
5
2 , and is a fermion. For present purposes, we shall focus
upon the O 2 isotopologues formed from 16 O and 18 O, as they nicely illustrate the
consequences for rotational spectroscopy of identical particle symmetry for nuclei
6 Molecular Systems
Fig. 6.16 Microdensitometer trace showing intensity alternations for adjacent transitions in the
Stokes region of the pure rotational Raman spectrum of room temperature 35 Cl 2 . From Edwards et
al. [35]. Reproduced by permission of The Royal Society of Chemistry
2.996, 1.395, and 1.215 for j o = 1, 3, and 5, respectively: however, by j o = 21,
for example, this factor has become 1.046, and hence, apart from the first few lines
in its Raman scattering spectrum, the intensity alternations should be very close to
the value 5:3 dictated by the degeneracies of the two nuclear spin modifications.
This is reasonably well verified by the Cl 2 Raman spectrum shown in Fig. 6.16. We
note, in passing, that the pure rotational Raman scattering spectrum consists solely
of an S-branch (for the same reason that the pure rotational infrared spectrum for a
heteronuclear diatomic molecule consists solely of an R-branch). Note also that in
Fig. 6.16 the wavenumber scale increases from right to left, so that we are indeed
looking at an S-branch spectrum.
Example 6.9 Rotational Raman spectra of molecular oxygen isotopologues.
Raman scattering by the O 2 isotopologues provides a good illustration of the
effects of identical particle symmetry. Oxygen has three stable isotopes, 16 O, 17 O,
and 18 O, with natural abundances of 99.757%, 0.038%, and 0.205%, respectively.
Features of the various oxygen isotopologues may be illustrated by comparisons
amongst the three sets of Raman lines obtained from Raman scattering in a mixture
of them, as shown in Fig. 6.17.
Both 16 O and 18 O have nuclear spins I a = 0, and are hence bosons, while 17 O
has nuclear spin I a =
5
2 , and is a fermion. For present purposes, we shall focus
upon the O 2 isotopologues formed from 16 O and 18 O, as they nicely illustrate the
consequences for rotational spectroscopy of identical particle symmetry for nuclei