

3.3 Introduction on Giant Magnetoresistance (GMR)
81
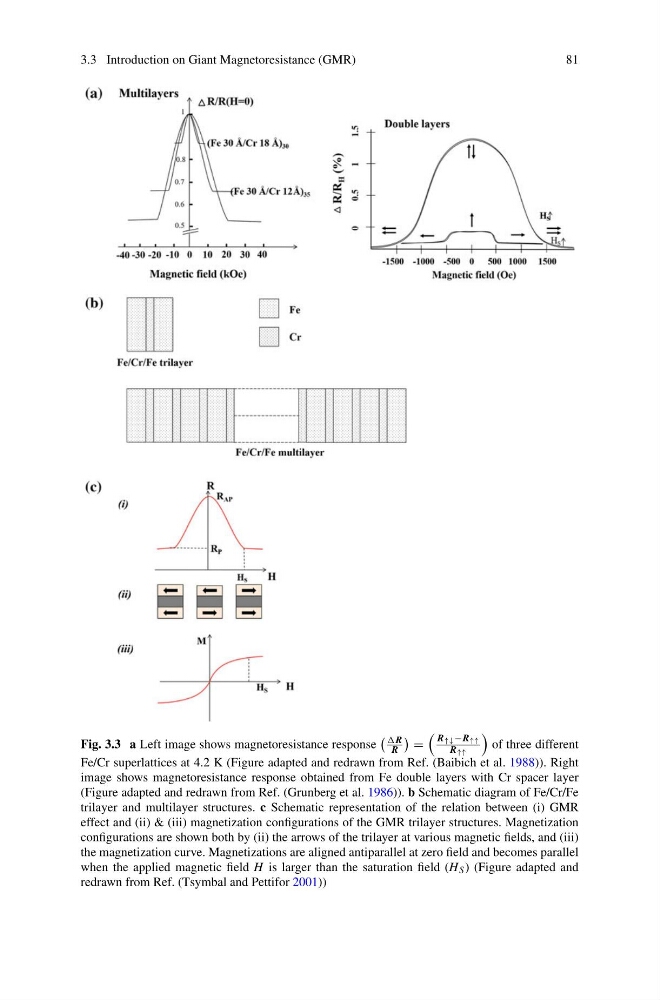
Fig. 3.3 a Left image shows magnetoresistance response
R
R
=
R ↑↓ −R ↑↑
R ↑↑
of three different
Fe/Cr superlattices at 4.2 K (Figure adapted and redrawn from Ref. (Baibich et al. 1988)). Right
image shows magnetoresistance response obtained from Fe double layers with Cr spacer layer
(Figure adapted and redrawn from Ref. (Grunberg et al. 1986)). b Schematic diagram of Fe/Cr/Fe
trilayer and multilayer structures. c Schematic representation of the relation between (i) GMR
effect and (ii) & (iii) magnetization configurations of the GMR trilayer structures. Magnetization
configurations are shown both by (ii) the arrows of the trilayer at various magnetic fields, and (iii)
the magnetization curve. Magnetizations are aligned antiparallel at zero field and becomes parallel
when the applied magnetic field H is larger than the saturation field (H S ) (Figure adapted and
redrawn from Ref. (Tsymbal and Pettifor 2001))
81
Fig. 3.3 a Left image shows magnetoresistance response
R
R
=
R ↑↓ −R ↑↑
R ↑↑
of three different
Fe/Cr superlattices at 4.2 K (Figure adapted and redrawn from Ref. (Baibich et al. 1988)). Right
image shows magnetoresistance response obtained from Fe double layers with Cr spacer layer
(Figure adapted and redrawn from Ref. (Grunberg et al. 1986)). b Schematic diagram of Fe/Cr/Fe
trilayer and multilayer structures. c Schematic representation of the relation between (i) GMR
effect and (ii) & (iii) magnetization configurations of the GMR trilayer structures. Magnetization
configurations are shown both by (ii) the arrows of the trilayer at various magnetic fields, and (iii)
the magnetization curve. Magnetizations are aligned antiparallel at zero field and becomes parallel
when the applied magnetic field H is larger than the saturation field (H S ) (Figure adapted and
redrawn from Ref. (Tsymbal and Pettifor 2001))