

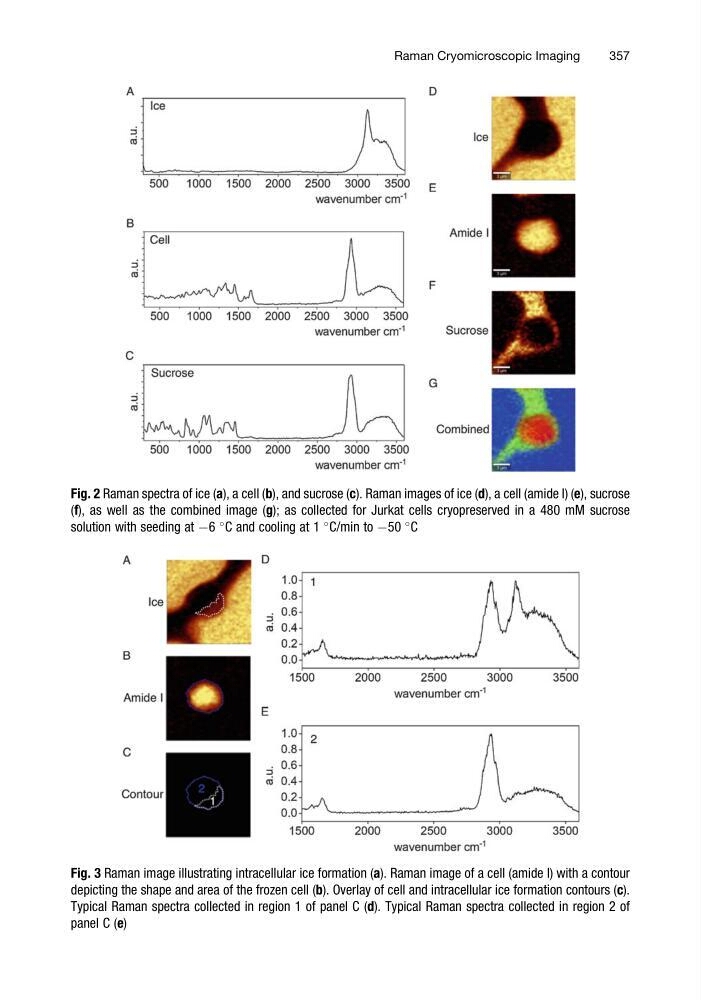
Fig. 2 Raman spectra of ice (a), a cell (b), and sucrose (c). Raman images of ice (d), a cell (amide I) (e), sucrose
(f), as well as the combined image (g); as collected for Jurkat cells cryopreserved in a 480 mM sucrose
solution with seeding at À6
C and cooling at 1
C/min to À50
C
Fig. 3 Raman image illustrating intracellular ice formation (a). Raman image of a cell (amide I) with a contour
depicting the shape and area of the frozen cell (b). Overlay of cell and intracellular ice formation contours (c).
Typical Raman spectra collected in region 1 of panel C (d). Typical Raman spectra collected in region 2 of
panel C (e)
Raman Cryomicroscopic Imaging
357
(f), as well as the combined image (g); as collected for Jurkat cells cryopreserved in a 480 mM sucrose
solution with seeding at À6
C and cooling at 1
C/min to À50
C
Fig. 3 Raman image illustrating intracellular ice formation (a). Raman image of a cell (amide I) with a contour
depicting the shape and area of the frozen cell (b). Overlay of cell and intracellular ice formation contours (c).
Typical Raman spectra collected in region 1 of panel C (d). Typical Raman spectra collected in region 2 of
panel C (e)
Raman Cryomicroscopic Imaging
357