

OH stretching peak of ice (see Fig. 3e). As a result, region
1 indicates the location of intracellular ice formation.
3. The ratio of cross-sectional area of intracellular ice formation
(region 1) to the cross-sectional area of the frozen cell (region
1 plus region 2) can be calculated to represent the relative
amount of ice formed in this cell.
3.4 Raman Spectra
and Image Analysis:
Distribution
of Cryoprotectants
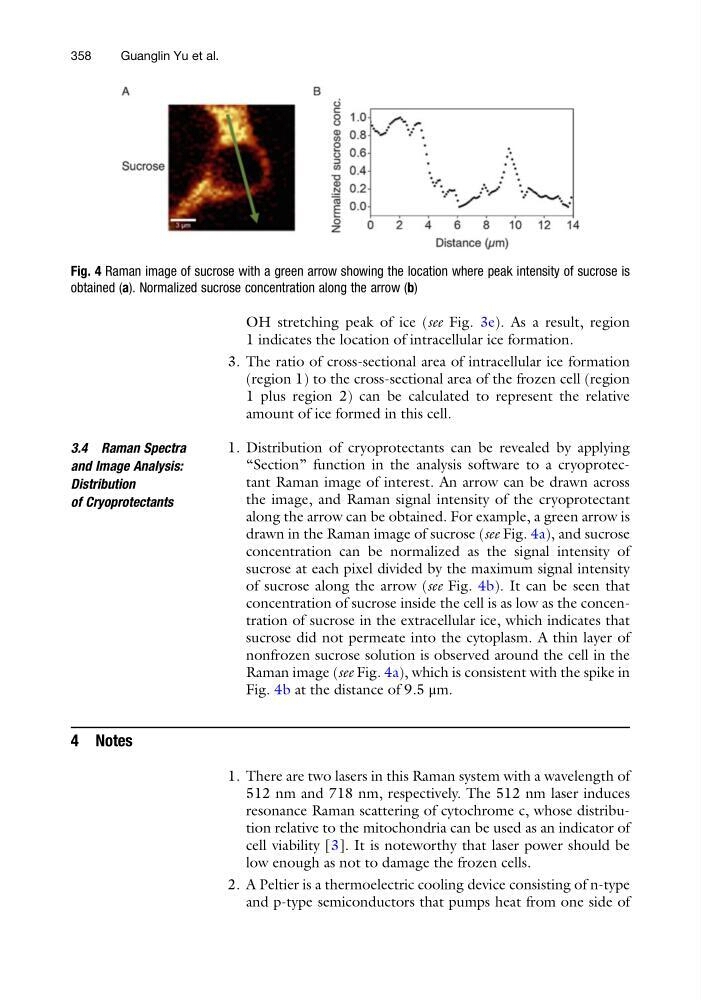
1. Distribution of cryoprotectants can be revealed by applying
“Section” function in the analysis software to a cryoprotectant Raman image of interest. An arrow can be drawn across
the image, and Raman signal intensity of the cryoprotectant
along the arrow can be obtained. For example, a green arrow is
drawn in the Raman image of sucrose (see Fig. 4a), and sucrose
concentration can be normalized as the signal intensity of
sucrose at each pixel divided by the maximum signal intensity
of sucrose along the arrow (see Fig. 4b). It can be seen that
concentration of sucrose inside the cell is as low as the concentration of sucrose in the extracellular ice, which indicates that
sucrose did not permeate into the cytoplasm. A thin layer of
nonfrozen sucrose solution is observed around the cell in the
Raman image (see Fig. 4a), which is consistent with the spike in
Fig. 4b at the distance of 9.5 μm.
4 Notes
1. There are two lasers in this Raman system with a wavelength of
512 nm and 718 nm, respectively. The 512 nm laser induces
resonance Raman scattering of cytochrome c, whose distribution relative to the mitochondria can be used as an indicator of
cell viability [3]. It is noteworthy that laser power should be
low enough as not to damage the frozen cells.
2. A Peltier is a thermoelectric cooling device consisting of n-type
and p-type semiconductors that pumps heat from one side of
Fig. 4 Raman image of sucrose with a green arrow showing the location where peak intensity of sucrose is
obtained (a). Normalized sucrose concentration along the arrow (b)
358
Guanglin Yu et al.
1 indicates the location of intracellular ice formation.
3. The ratio of cross-sectional area of intracellular ice formation
(region 1) to the cross-sectional area of the frozen cell (region
1 plus region 2) can be calculated to represent the relative
amount of ice formed in this cell.
3.4 Raman Spectra
and Image Analysis:
Distribution
of Cryoprotectants
1. Distribution of cryoprotectants can be revealed by applying
“Section” function in the analysis software to a cryoprotectant Raman image of interest. An arrow can be drawn across
the image, and Raman signal intensity of the cryoprotectant
along the arrow can be obtained. For example, a green arrow is
drawn in the Raman image of sucrose (see Fig. 4a), and sucrose
concentration can be normalized as the signal intensity of
sucrose at each pixel divided by the maximum signal intensity
of sucrose along the arrow (see Fig. 4b). It can be seen that
concentration of sucrose inside the cell is as low as the concentration of sucrose in the extracellular ice, which indicates that
sucrose did not permeate into the cytoplasm. A thin layer of
nonfrozen sucrose solution is observed around the cell in the
Raman image (see Fig. 4a), which is consistent with the spike in
Fig. 4b at the distance of 9.5 μm.
4 Notes
1. There are two lasers in this Raman system with a wavelength of
512 nm and 718 nm, respectively. The 512 nm laser induces
resonance Raman scattering of cytochrome c, whose distribution relative to the mitochondria can be used as an indicator of
cell viability [3]. It is noteworthy that laser power should be
low enough as not to damage the frozen cells.
2. A Peltier is a thermoelectric cooling device consisting of n-type
and p-type semiconductors that pumps heat from one side of
Fig. 4 Raman image of sucrose with a green arrow showing the location where peak intensity of sucrose is
obtained (a). Normalized sucrose concentration along the arrow (b)
358
Guanglin Yu et al.