

background subtraction at both sides of the peak range to
separate ice signals from other OH stretching signals. All the
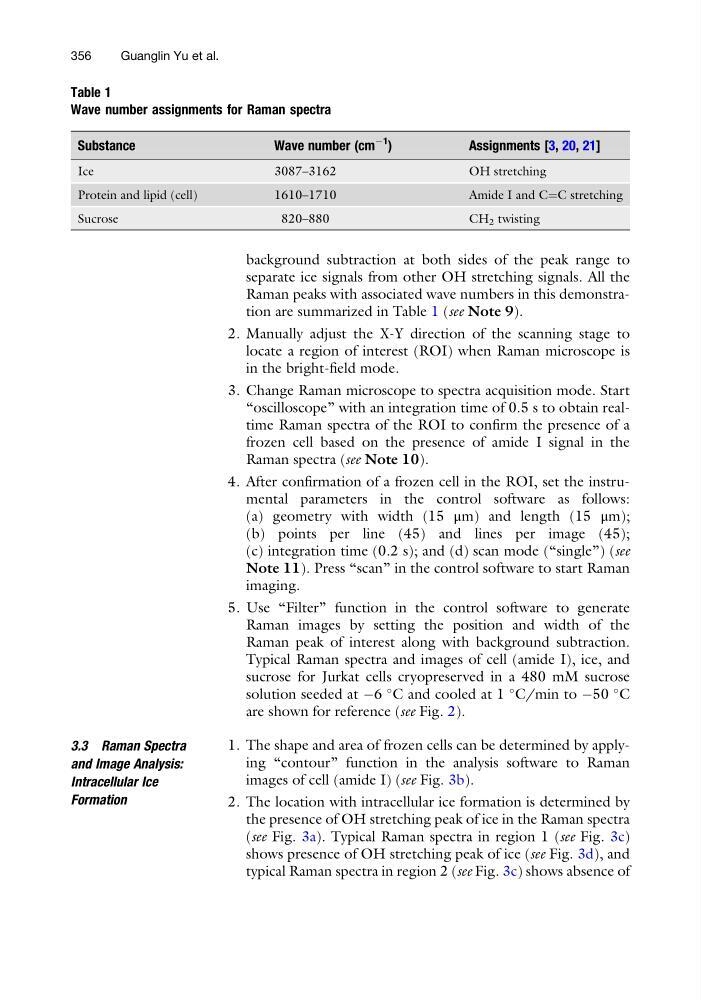
Raman peaks with associated wave numbers in this demonstration are summarized in Table 1 (see Note 9).
2. Manually adjust the X-Y direction of the scanning stage to
locate a region of interest (ROI) when Raman microscope is
in the bright-field mode.
3. Change Raman microscope to spectra acquisition mode. Start
“oscilloscope” with an integration time of 0.5 s to obtain realtime Raman spectra of the ROI to confirm the presence of a
frozen cell based on the presence of amide I signal in the
Raman spectra (see Note 10).
4. After confirmation of a frozen cell in the ROI, set the instrumental parameters in the control software as follows:
(a) geometry with width (15 μm) and length (15 μm);
(b) points per line (45) and lines per image (45);
(c) integration time (0.2 s); and (d) scan mode (“single”) (see
Note 11). Press “scan” in the control software to start Raman
imaging.
5. Use “Filter” function in the control software to generate
Raman images by setting the position and width of the
Raman peak of interest along with background subtraction.
Typical Raman spectra and images of cell (amide I), ice, and
sucrose for Jurkat cells cryopreserved in a 480 mM sucrose
solution seeded at À6
C and cooled at 1
C/min to À50
C
are shown for reference (see Fig. 2).
3.3 Raman Spectra
and Image Analysis:
Intracellular Ice
Formation
1. The shape and area of frozen cells can be determined by applying “contour” function in the analysis software to Raman
images of cell (amide I) (see Fig. 3b).
2. The location with intracellular ice formation is determined by
the presence of OH stretching peak of ice in the Raman spectra
(see Fig. 3a). Typical Raman spectra in region 1 (see Fig. 3c)
shows presence of OH stretching peak of ice (see Fig. 3d), and
typical Raman spectra in region 2 (see Fig. 3c) shows absence of
Table 1
Wave number assignments for Raman spectra
Substance
Wave number (cm
À1
)
Assignments [3, 20, 21]
Ice
3087–3162
OH stretching
Protein and lipid (cell)
1610–1710
Amide I and C¼C stretching
Sucrose
820–880
CH 2 twisting
356
Guanglin Yu et al.
separate ice signals from other OH stretching signals. All the
Raman peaks with associated wave numbers in this demonstration are summarized in Table 1 (see Note 9).
2. Manually adjust the X-Y direction of the scanning stage to
locate a region of interest (ROI) when Raman microscope is
in the bright-field mode.
3. Change Raman microscope to spectra acquisition mode. Start
“oscilloscope” with an integration time of 0.5 s to obtain realtime Raman spectra of the ROI to confirm the presence of a
frozen cell based on the presence of amide I signal in the
Raman spectra (see Note 10).
4. After confirmation of a frozen cell in the ROI, set the instrumental parameters in the control software as follows:
(a) geometry with width (15 μm) and length (15 μm);
(b) points per line (45) and lines per image (45);
(c) integration time (0.2 s); and (d) scan mode (“single”) (see
Note 11). Press “scan” in the control software to start Raman
imaging.
5. Use “Filter” function in the control software to generate
Raman images by setting the position and width of the
Raman peak of interest along with background subtraction.
Typical Raman spectra and images of cell (amide I), ice, and
sucrose for Jurkat cells cryopreserved in a 480 mM sucrose
solution seeded at À6
C and cooled at 1
C/min to À50
C
are shown for reference (see Fig. 2).
3.3 Raman Spectra
and Image Analysis:
Intracellular Ice
Formation
1. The shape and area of frozen cells can be determined by applying “contour” function in the analysis software to Raman
images of cell (amide I) (see Fig. 3b).
2. The location with intracellular ice formation is determined by
the presence of OH stretching peak of ice in the Raman spectra
(see Fig. 3a). Typical Raman spectra in region 1 (see Fig. 3c)
shows presence of OH stretching peak of ice (see Fig. 3d), and
typical Raman spectra in region 2 (see Fig. 3c) shows absence of
Table 1
Wave number assignments for Raman spectra
Substance
Wave number (cm
À1
)
Assignments [3, 20, 21]
Ice
3087–3162
OH stretching
Protein and lipid (cell)
1610–1710
Amide I and C¼C stretching
Sucrose
820–880
CH 2 twisting
356
Guanglin Yu et al.