

3.3 Acquisition
of Spectra During
Drying of a Sample
Under Controlled
Humidity Conditions,
Using the ATR Device
1. Concentrate the sample by centrifugation (e.g., 0.5–1 mL cell
or lipid suspension, 1200 Â g for 1 min) and transfer a defined
amount of hydrated pellet (e.g., 2 μL) on the diamond/ZeSn
ATR crystal. Alternatively, use a tissue (scaffold) slice.
2. Close the donut-shaped dish with saturated salt solution
around the sample area, to maintain the defined relative humidity conditions.
3. In the program for acquisition of spectra at timed intervals,
enter the settings for spectra acquisition (timed interval of, e.g.,
30 s, duration of the run, and file name for the spectra) and
scan settings (8 co-added interferograms, 4000–900 cm
À1
wave number range).
4. Start the program for spectra acquisition at timed intervals.
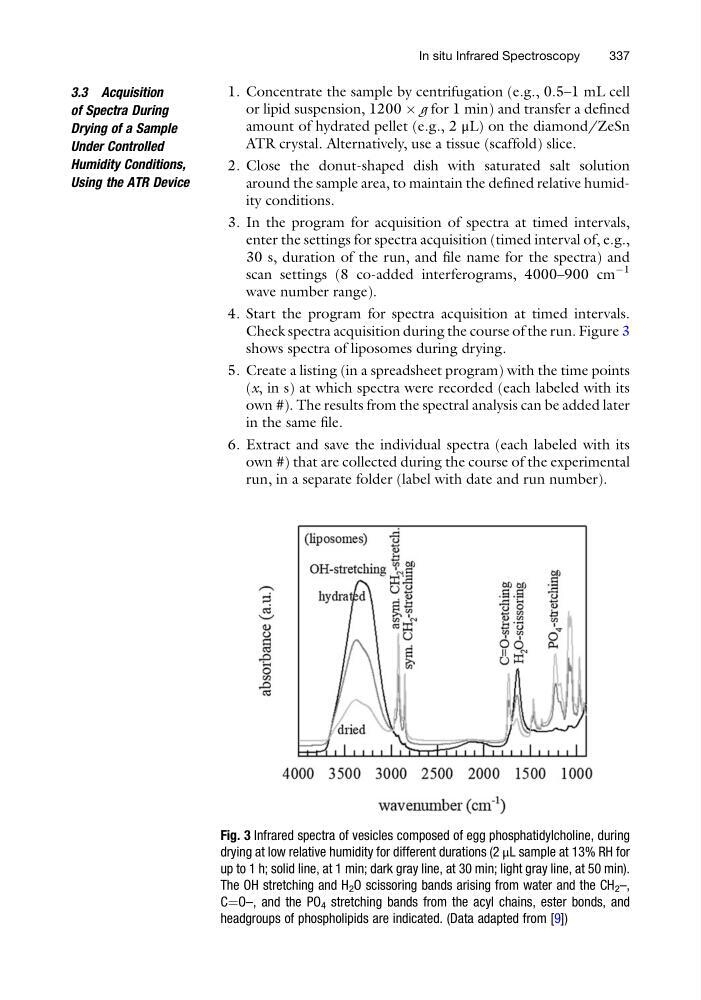
Check spectra acquisition during the course of the run. Figure 3
shows spectra of liposomes during drying.
5. Create a listing (in a spreadsheet program) with the time points
(x, in s) at which spectra were recorded (each labeled with its
own #). The results from the spectral analysis can be added later
in the same file.
6. Extract and save the individual spectra (each labeled with its
own #) that are collected during the course of the experimental
run, in a separate folder (label with date and run number).
Fig. 3 Infrared spectra of vesicles composed of egg phosphatidylcholine, during
drying at low relative humidity for different durations (2 μL sample at 13% RH for
up to 1 h; solid line, at 1 min; dark gray line, at 30 min; light gray line, at 50 min).
The OH stretching and H 2 O scissoring bands arising from water and the CH 2 –,
C¼O–, and the PO 4 stretching bands from the acyl chains, ester bonds, and
headgroups of phospholipids are indicated. (Data adapted from [9])
In situ Infrared Spectroscopy
337
of Spectra During
Drying of a Sample
Under Controlled
Humidity Conditions,
Using the ATR Device
1. Concentrate the sample by centrifugation (e.g., 0.5–1 mL cell
or lipid suspension, 1200 Â g for 1 min) and transfer a defined
amount of hydrated pellet (e.g., 2 μL) on the diamond/ZeSn
ATR crystal. Alternatively, use a tissue (scaffold) slice.
2. Close the donut-shaped dish with saturated salt solution
around the sample area, to maintain the defined relative humidity conditions.
3. In the program for acquisition of spectra at timed intervals,
enter the settings for spectra acquisition (timed interval of, e.g.,
30 s, duration of the run, and file name for the spectra) and
scan settings (8 co-added interferograms, 4000–900 cm
À1
wave number range).
4. Start the program for spectra acquisition at timed intervals.
Check spectra acquisition during the course of the run. Figure 3
shows spectra of liposomes during drying.
5. Create a listing (in a spreadsheet program) with the time points
(x, in s) at which spectra were recorded (each labeled with its
own #). The results from the spectral analysis can be added later
in the same file.
6. Extract and save the individual spectra (each labeled with its
own #) that are collected during the course of the experimental
run, in a separate folder (label with date and run number).
Fig. 3 Infrared spectra of vesicles composed of egg phosphatidylcholine, during
drying at low relative humidity for different durations (2 μL sample at 13% RH for
up to 1 h; solid line, at 1 min; dark gray line, at 30 min; light gray line, at 50 min).
The OH stretching and H 2 O scissoring bands arising from water and the CH 2 –,
C¼O–, and the PO 4 stretching bands from the acyl chains, ester bonds, and
headgroups of phospholipids are indicated. (Data adapted from [9])
In situ Infrared Spectroscopy
337