

sample needs to be directly in light contact with the diamond/
ZnSe crystal, while the setup should not be leaky when adding
solution on top (see Note 12).
3. Add 1 mL of protective solution (mixtures of protectants can
also be studied) on top of the tissue sample.
4. Start acquisition of spectra by starting the program for spectra
acquisition. Check spectra during the first scans to verify that
no leakage has occurred during mounting. Prepare a new sample if needed (see Note 13). To avoid evaporation, the sample
holder needs to be covered with parafilm on top. The sample
holder can be held in place using the pressure arm of the ATR
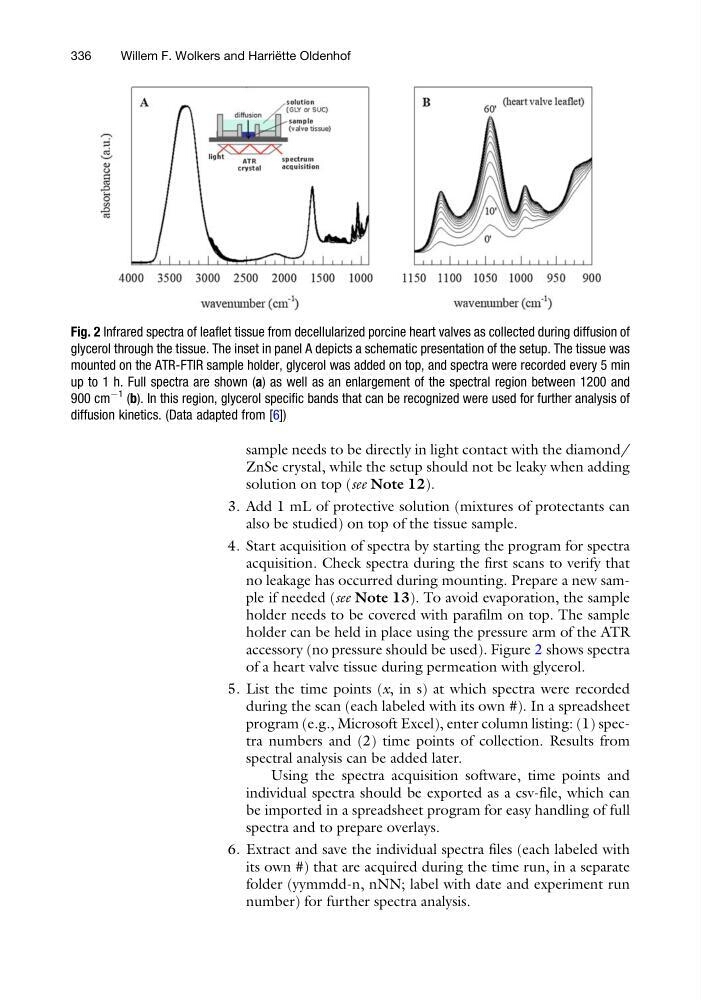
accessory (no pressure should be used). Figure 2 shows spectra
of a heart valve tissue during permeation with glycerol.
5. List the time points (x, in s) at which spectra were recorded
during the scan (each labeled with its own #). In a spreadsheet
program (e.g., Microsoft Excel), enter column listing: (1) spectra numbers and (2) time points of collection. Results from
spectral analysis can be added later.
Using the spectra acquisition software, time points and
individual spectra should be exported as a csv-file, which can
be imported in a spreadsheet program for easy handling of full
spectra and to prepare overlays.
6. Extract and save the individual spectra files (each labeled with
its own #) that are acquired during the time run, in a separate
folder (yymmdd-n, nNN; label with date and experiment run
number) for further spectra analysis.
Fig. 2 Infrared spectra of leaflet tissue from decellularized porcine heart valves as collected during diffusion of
glycerol through the tissue. The inset in panel A depicts a schematic presentation of the setup. The tissue was
mounted on the ATR-FTIR sample holder, glycerol was added on top, and spectra were recorded every 5 min
up to 1 h. Full spectra are shown (a) as well as an enlargement of the spectral region between 1200 and
900 cm
À1 (b). In this region, glycerol specific bands that can be recognized were used for further analysis of
diffusion kinetics. (Data adapted from [6])
336
Willem F. Wolkers and Harrie ¨ tte Oldenhof
ZnSe crystal, while the setup should not be leaky when adding
solution on top (see Note 12).
3. Add 1 mL of protective solution (mixtures of protectants can
also be studied) on top of the tissue sample.
4. Start acquisition of spectra by starting the program for spectra
acquisition. Check spectra during the first scans to verify that
no leakage has occurred during mounting. Prepare a new sample if needed (see Note 13). To avoid evaporation, the sample
holder needs to be covered with parafilm on top. The sample
holder can be held in place using the pressure arm of the ATR
accessory (no pressure should be used). Figure 2 shows spectra
of a heart valve tissue during permeation with glycerol.
5. List the time points (x, in s) at which spectra were recorded
during the scan (each labeled with its own #). In a spreadsheet
program (e.g., Microsoft Excel), enter column listing: (1) spectra numbers and (2) time points of collection. Results from
spectral analysis can be added later.
Using the spectra acquisition software, time points and
individual spectra should be exported as a csv-file, which can
be imported in a spreadsheet program for easy handling of full
spectra and to prepare overlays.
6. Extract and save the individual spectra files (each labeled with
its own #) that are acquired during the time run, in a separate
folder (yymmdd-n, nNN; label with date and experiment run
number) for further spectra analysis.
Fig. 2 Infrared spectra of leaflet tissue from decellularized porcine heart valves as collected during diffusion of
glycerol through the tissue. The inset in panel A depicts a schematic presentation of the setup. The tissue was
mounted on the ATR-FTIR sample holder, glycerol was added on top, and spectra were recorded every 5 min
up to 1 h. Full spectra are shown (a) as well as an enlargement of the spectral region between 1200 and
900 cm
À1 (b). In this region, glycerol specific bands that can be recognized were used for further analysis of
diffusion kinetics. (Data adapted from [6])
336
Willem F. Wolkers and Harrie ¨ tte Oldenhof