

9. Open the first sample of the Me 2 SO solutions and select the
color scale. Use the specific tool of the analysis to transform the
CT values to Hounsfield Units (HU), the standard units for
CT output, according to the following equation:
HU ¼ 1000 Â
CT sample À CT water
CT water À CT air
where HU is the X-ray attenuation in HU and CT in the raw
units of the CT device (CT values). Use the CT values of water
obtained at the step 8 for (CT water ), and use 0 for the CT value
of air (CT air ). Save the image in HU units.
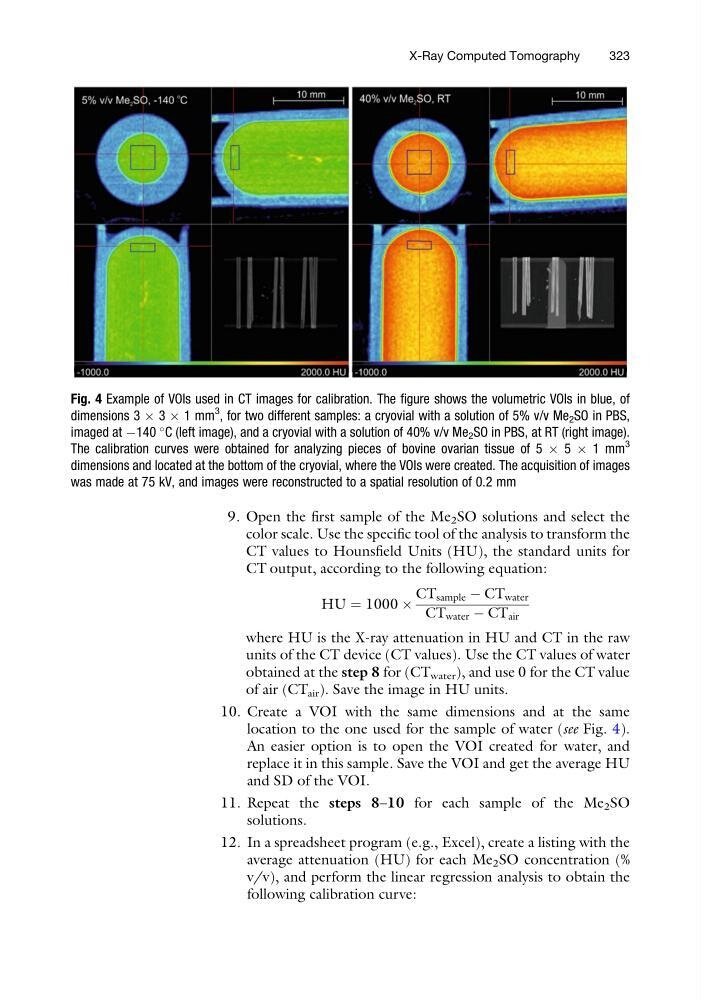
10. Create a VOI with the same dimensions and at the same
location to the one used for the sample of water (see Fig. 4).
An easier option is to open the VOI created for water, and
replace it in this sample. Save the VOI and get the average HU
and SD of the VOI.
11. Repeat the steps 8–10 for each sample of the Me 2 SO
solutions.
12. In a spreadsheet program (e.g., Excel), create a listing with the
average attenuation (HU) for each Me 2 SO concentration (%
v/v), and perform the linear regression analysis to obtain the
following calibration curve:
Fig. 4 Example of VOIs used in CT images for calibration. The figure shows the volumetric VOIs in blue, of
dimensions 3 Â 3 Â 1 mm
3
, for two different samples: a cryovial with a solution of 5% v/v Me 2 SO in PBS,
imaged at À140
C (left image), and a cryovial with a solution of 40% v/v Me 2 SO in PBS, at RT (right image).
The calibration curves were obtained for analyzing pieces of bovine ovarian tissue of 5 Â 5 Â 1 mm
3
dimensions and located at the bottom of the cryovial, where the VOIs were created. The acquisition of images
was made at 75 kV, and images were reconstructed to a spatial resolution of 0.2 mm
X-Ray Computed Tomography
323
color scale. Use the specific tool of the analysis to transform the
CT values to Hounsfield Units (HU), the standard units for
CT output, according to the following equation:
HU ¼ 1000 Â
CT sample À CT water
CT water À CT air
where HU is the X-ray attenuation in HU and CT in the raw
units of the CT device (CT values). Use the CT values of water
obtained at the step 8 for (CT water ), and use 0 for the CT value
of air (CT air ). Save the image in HU units.
10. Create a VOI with the same dimensions and at the same
location to the one used for the sample of water (see Fig. 4).
An easier option is to open the VOI created for water, and
replace it in this sample. Save the VOI and get the average HU
and SD of the VOI.
11. Repeat the steps 8–10 for each sample of the Me 2 SO
solutions.
12. In a spreadsheet program (e.g., Excel), create a listing with the
average attenuation (HU) for each Me 2 SO concentration (%
v/v), and perform the linear regression analysis to obtain the
following calibration curve:
Fig. 4 Example of VOIs used in CT images for calibration. The figure shows the volumetric VOIs in blue, of
dimensions 3 Â 3 Â 1 mm
3
, for two different samples: a cryovial with a solution of 5% v/v Me 2 SO in PBS,
imaged at À140
C (left image), and a cryovial with a solution of 40% v/v Me 2 SO in PBS, at RT (right image).
The calibration curves were obtained for analyzing pieces of bovine ovarian tissue of 5 Â 5 Â 1 mm
3
dimensions and located at the bottom of the cryovial, where the VOIs were created. The acquisition of images
was made at 75 kV, and images were reconstructed to a spatial resolution of 0.2 mm
X-Ray Computed Tomography
323