

7. Count the total number of cells in each video, excluding those
cells that were disqualified in steps 1 and 6 (see Note 108).
This is the initial size of the so-called risk group.
8. Among the interpolated temperature values corresponding to
video end frames (see step 3), identify the highest temperature
(which corresponds to the earliest end time). Kinetics of intracellular ice formation will not be estimated past this temperature (see Note 107).
9. Make a list of all interpolated intracellular ice formation temperatures (from all videos) that fall between the temperatures
identified in steps 6 and 8 (inclusive). Using a spreadsheet
program (or any computational software with similar functionality), enter these values into a data column and sort the
temperatures in descending order (i.e., in order of increasing
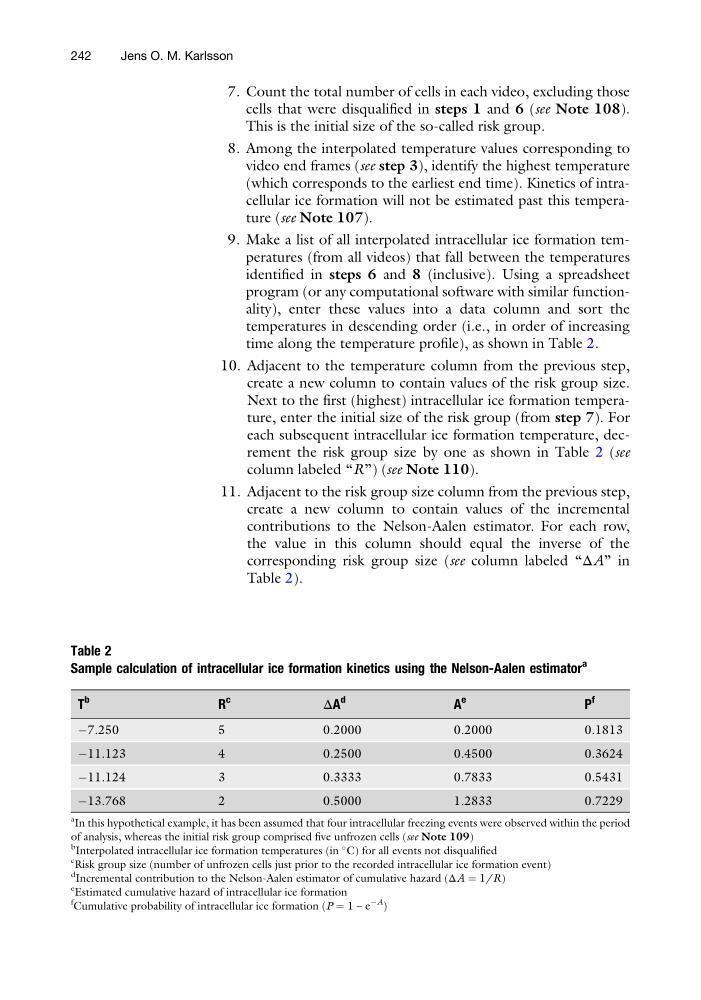
time along the temperature profile), as shown in Table 2.
10. Adjacent to the temperature column from the previous step,
create a new column to contain values of the risk group size.
Next to the first (highest) intracellular ice formation temperature, enter the initial size of the risk group (from step 7). For
each subsequent intracellular ice formation temperature, decrement the risk group size by one as shown in Table 2 (see
column labeled “R”) (see Note 110).
11. Adjacent to the risk group size column from the previous step,
create a new column to contain values of the incremental
contributions to the Nelson-Aalen estimator. For each row,
the value in this column should equal the inverse of the
corresponding risk group size (see column labeled “ΔA” in
Table 2).
Table 2
Sample calculation of intracellular ice formation kinetics using the Nelson-Aalen estimator
a
T
b
R
c
ΔA
d
A
e
P
f
À7.250
5
0.2000
0.2000
0.1813
À11.123
4
0.2500
0.4500
0.3624
À11.124
3
0.3333
0.7833
0.5431
À13.768
2
0.5000
1.2833
0.7229
a
In this hypothetical example, it has been assumed that four intracellular freezing events were observed within the period
of analysis, whereas the initial risk group comprised five unfrozen cells (see Note 109)
b
Interpolated intracellular ice formation temperatures (in
C) for all events not disqualified
c
Risk group size (number of unfrozen cells just prior to the recorded intracellular ice formation event)
d
Incremental contribution to the Nelson-Aalen estimator of cumulative hazard (ΔA ¼ 1/R)
e
Estimated cumulative hazard of intracellular ice formation
f Cumulative probability of intracellular ice formation (P ¼ 1 – e
ÀA
)
242
Jens O. M. Karlsson
cells that were disqualified in steps 1 and 6 (see Note 108).
This is the initial size of the so-called risk group.
8. Among the interpolated temperature values corresponding to
video end frames (see step 3), identify the highest temperature
(which corresponds to the earliest end time). Kinetics of intracellular ice formation will not be estimated past this temperature (see Note 107).
9. Make a list of all interpolated intracellular ice formation temperatures (from all videos) that fall between the temperatures
identified in steps 6 and 8 (inclusive). Using a spreadsheet
program (or any computational software with similar functionality), enter these values into a data column and sort the
temperatures in descending order (i.e., in order of increasing
time along the temperature profile), as shown in Table 2.
10. Adjacent to the temperature column from the previous step,
create a new column to contain values of the risk group size.
Next to the first (highest) intracellular ice formation temperature, enter the initial size of the risk group (from step 7). For
each subsequent intracellular ice formation temperature, decrement the risk group size by one as shown in Table 2 (see
column labeled “R”) (see Note 110).
11. Adjacent to the risk group size column from the previous step,
create a new column to contain values of the incremental
contributions to the Nelson-Aalen estimator. For each row,
the value in this column should equal the inverse of the
corresponding risk group size (see column labeled “ΔA” in
Table 2).
Table 2
Sample calculation of intracellular ice formation kinetics using the Nelson-Aalen estimator
a
T
b
R
c
ΔA
d
A
e
P
f
À7.250
5
0.2000
0.2000
0.1813
À11.123
4
0.2500
0.4500
0.3624
À11.124
3
0.3333
0.7833
0.5431
À13.768
2
0.5000
1.2833
0.7229
a
In this hypothetical example, it has been assumed that four intracellular freezing events were observed within the period
of analysis, whereas the initial risk group comprised five unfrozen cells (see Note 109)
b
Interpolated intracellular ice formation temperatures (in
C) for all events not disqualified
c
Risk group size (number of unfrozen cells just prior to the recorded intracellular ice formation event)
d
Incremental contribution to the Nelson-Aalen estimator of cumulative hazard (ΔA ¼ 1/R)
e
Estimated cumulative hazard of intracellular ice formation
f Cumulative probability of intracellular ice formation (P ¼ 1 – e
ÀA
)
242
Jens O. M. Karlsson