

5. For each video, use the following interpolation technique to
estimate the cryomicroscope stage temperature associated with
the timestamps collected in steps 2–3. In the text file containing the Linksys32 measurements, the data are arranged in rows
containing three values each; if imported into a spreadsheet
program, these will be allocated to three columns. The first
column represents the time (in seconds), relative to the start of
data logging (see step 3 in Subheading 3.6); the second column
represents the stage temperature (in Celsius); the third column
contains data from the vacuum controller expansion card (used
here to monitor the trigger signal; see Note 20).
(a) Start by identifying the row in which the vacuum card
value in the third column first drops to zero (or to a value
near zero): this is the trigger event, and the corresponding
time value (first column) will be designated t trigger in what
follows.
(b) If necessary, convert the timestamp value for the video
frame of interest to units of seconds (see Note 105); the
corresponding value (in seconds) will be designated t frame .
(c) Compute the interpolated time value (designated t int ) by
adding t trigger and t frame :
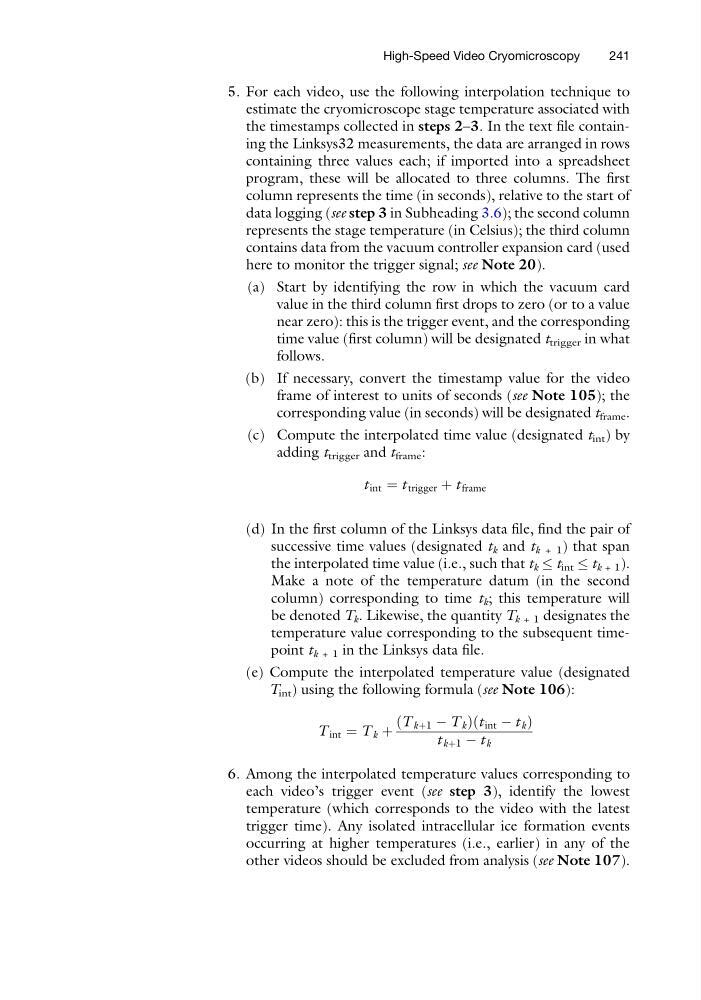
t int ¼ t trigger þ t frame
(d) In the first column of the Linksys data file, find the pair of
successive time values (designated t k and t k + 1 ) that span
the interpolated time value (i.e., such that t k t int t k + 1 ).
Make a note of the temperature datum (in the second
column) corresponding to time t k ; this temperature will
be denoted T k . Likewise, the quantity T k + 1 designates the
temperature value corresponding to the subsequent timepoint t k + 1 in the Linksys data file.
(e) Compute the interpolated temperature value (designated
T int ) using the following formula (see Note 106):
T int ¼ T k þ
T kþ1 À T k
ð
Þt int À t k
ð
Þ
t kþ1 À t k
6. Among the interpolated temperature values corresponding to
each video’s trigger event (see step 3), identify the lowest
temperature (which corresponds to the video with the latest
trigger time). Any isolated intracellular ice formation events
occurring at higher temperatures (i.e., earlier) in any of the
other videos should be excluded from analysis (see Note 107).
High-Speed Video Cryomicroscopy
241
estimate the cryomicroscope stage temperature associated with
the timestamps collected in steps 2–3. In the text file containing the Linksys32 measurements, the data are arranged in rows
containing three values each; if imported into a spreadsheet
program, these will be allocated to three columns. The first
column represents the time (in seconds), relative to the start of
data logging (see step 3 in Subheading 3.6); the second column
represents the stage temperature (in Celsius); the third column
contains data from the vacuum controller expansion card (used
here to monitor the trigger signal; see Note 20).
(a) Start by identifying the row in which the vacuum card
value in the third column first drops to zero (or to a value
near zero): this is the trigger event, and the corresponding
time value (first column) will be designated t trigger in what
follows.
(b) If necessary, convert the timestamp value for the video
frame of interest to units of seconds (see Note 105); the
corresponding value (in seconds) will be designated t frame .
(c) Compute the interpolated time value (designated t int ) by
adding t trigger and t frame :
t int ¼ t trigger þ t frame
(d) In the first column of the Linksys data file, find the pair of
successive time values (designated t k and t k + 1 ) that span
the interpolated time value (i.e., such that t k t int t k + 1 ).
Make a note of the temperature datum (in the second
column) corresponding to time t k ; this temperature will
be denoted T k . Likewise, the quantity T k + 1 designates the
temperature value corresponding to the subsequent timepoint t k + 1 in the Linksys data file.
(e) Compute the interpolated temperature value (designated
T int ) using the following formula (see Note 106):
T int ¼ T k þ
T kþ1 À T k
ð
Þt int À t k
ð
Þ
t kþ1 À t k
6. Among the interpolated temperature values corresponding to
each video’s trigger event (see step 3), identify the lowest
temperature (which corresponds to the video with the latest
trigger time). Any isolated intracellular ice formation events
occurring at higher temperatures (i.e., earlier) in any of the
other videos should be excluded from analysis (see Note 107).
High-Speed Video Cryomicroscopy
241