

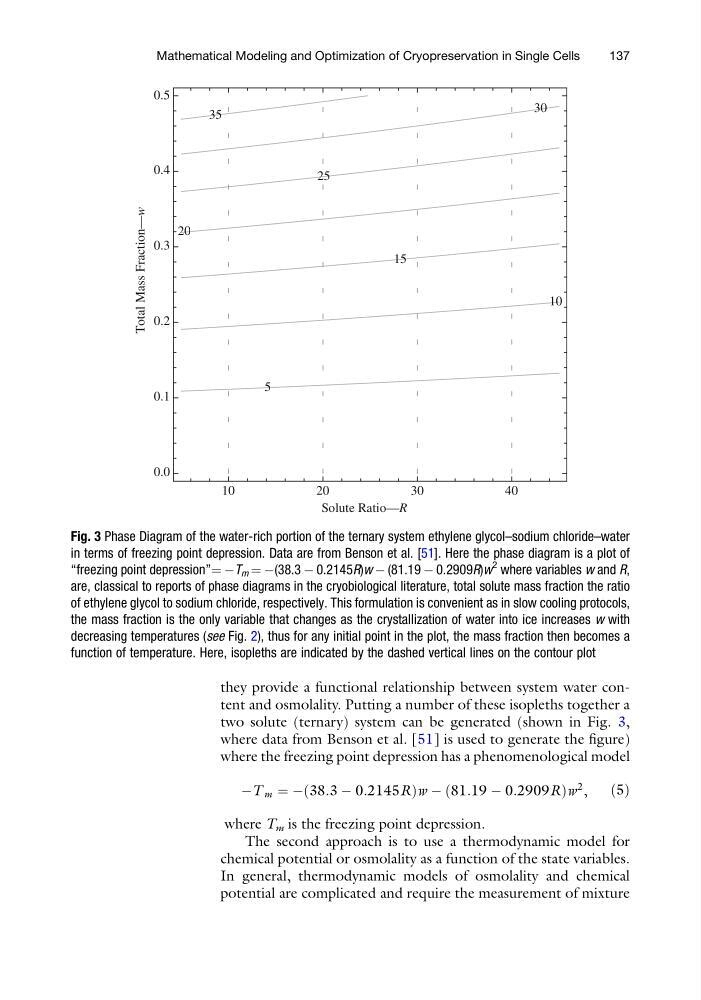
they provide a functional relationship between system water content and osmolality. Putting a number of these isopleths together a
two solute (ternary) system can be generated (shown in Fig. 3,
where data from Benson et al. [51] is used to generate the figure)
where the freezing point depression has a phenomenological model
ÀT m ¼ Àð38:3 À 0:2145RÞw À ð81:19 À 0:2909RÞw
2 ,
ð5Þ
where T m is the freezing point depression.
The second approach is to use a thermodynamic model for
chemical potential or osmolality as a function of the state variables.
In general, thermodynamic models of osmolality and chemical
potential are complicated and require the measurement of mixture
5
10
15
20
25
30
35
10
20
30
40
0.0
0.1
0.2
0.3
0.4
0.5
Solute Ratio—R
Total Mass Fraction—w
Fig. 3 Phase Diagram of the water-rich portion of the ternary system ethylene glycol–sodium chloride–water
in terms of freezing point depression. Data are from Benson et al. [51]. Here the phase diagram is a plot of
“freezing point depression”¼ ÀT m ¼ À(38.3 À 0.2145R)w À (81.19 À 0.2909R)w
2 where variables w and R,
are, classical to reports of phase diagrams in the cryobiological literature, total solute mass fraction the ratio
of ethylene glycol to sodium chloride, respectively. This formulation is convenient as in slow cooling protocols,
the mass fraction is the only variable that changes as the crystallization of water into ice increases w with
decreasing temperatures (see Fig. 2), thus for any initial point in the plot, the mass fraction then becomes a
function of temperature. Here, isopleths are indicated by the dashed vertical lines on the contour plot
Mathematical Modeling and Optimization of Cryopreservation in Single Cells
137
two solute (ternary) system can be generated (shown in Fig. 3,
where data from Benson et al. [51] is used to generate the figure)
where the freezing point depression has a phenomenological model
ÀT m ¼ Àð38:3 À 0:2145RÞw À ð81:19 À 0:2909RÞw
2 ,
ð5Þ
where T m is the freezing point depression.
The second approach is to use a thermodynamic model for
chemical potential or osmolality as a function of the state variables.
In general, thermodynamic models of osmolality and chemical
potential are complicated and require the measurement of mixture
5
10
15
20
25
30
35
10
20
30
40
0.0
0.1
0.2
0.3
0.4
0.5
Solute Ratio—R
Total Mass Fraction—w
Fig. 3 Phase Diagram of the water-rich portion of the ternary system ethylene glycol–sodium chloride–water
in terms of freezing point depression. Data are from Benson et al. [51]. Here the phase diagram is a plot of
“freezing point depression”¼ ÀT m ¼ À(38.3 À 0.2145R)w À (81.19 À 0.2909R)w
2 where variables w and R,
are, classical to reports of phase diagrams in the cryobiological literature, total solute mass fraction the ratio
of ethylene glycol to sodium chloride, respectively. This formulation is convenient as in slow cooling protocols,
the mass fraction is the only variable that changes as the crystallization of water into ice increases w with
decreasing temperatures (see Fig. 2), thus for any initial point in the plot, the mass fraction then becomes a
function of temperature. Here, isopleths are indicated by the dashed vertical lines on the contour plot
Mathematical Modeling and Optimization of Cryopreservation in Single Cells
137