

differential scanning calorimeter is typically used to measure the
melting temperature of a family of solutions as a function of the
relative concentration of their constituents. Using Raoult’s Law
(see, e.g. [49]), or a more thermodynamically applicable variant
[50], the relationship between osmolality and freezing point
depression is used to determine solution osmolality. To formulate
a model for this relationship, measurements of the melting temperature of solutions containing concentrations of its constituent species are made. With enough of these measurements, a graph over
the surface of concentration of solutes can be found that describes
the phase diagram. We note that the system dimension increases
with each constituent and thus the number of measurements
increases exponentially with the number of constituents. For example, if n measurements are required to accurately describe a binary
mixture, on the order n
2 measurements are required to accurately
describe a ternary mixture, n
3 for a quaternary mixture, etc. This
cumbersome experimental requirement is one of the primary motivators for the synthetic or theoretically generated phase diagrams
discussed below.
Of classical interest to cryobiologists is the case where the
extracellular media contains one CPA and a primary
non-permeating salt such as NaCl. In this case, the isopleth defined
by fixing the ratio R of, for example, salt and CPA is an important
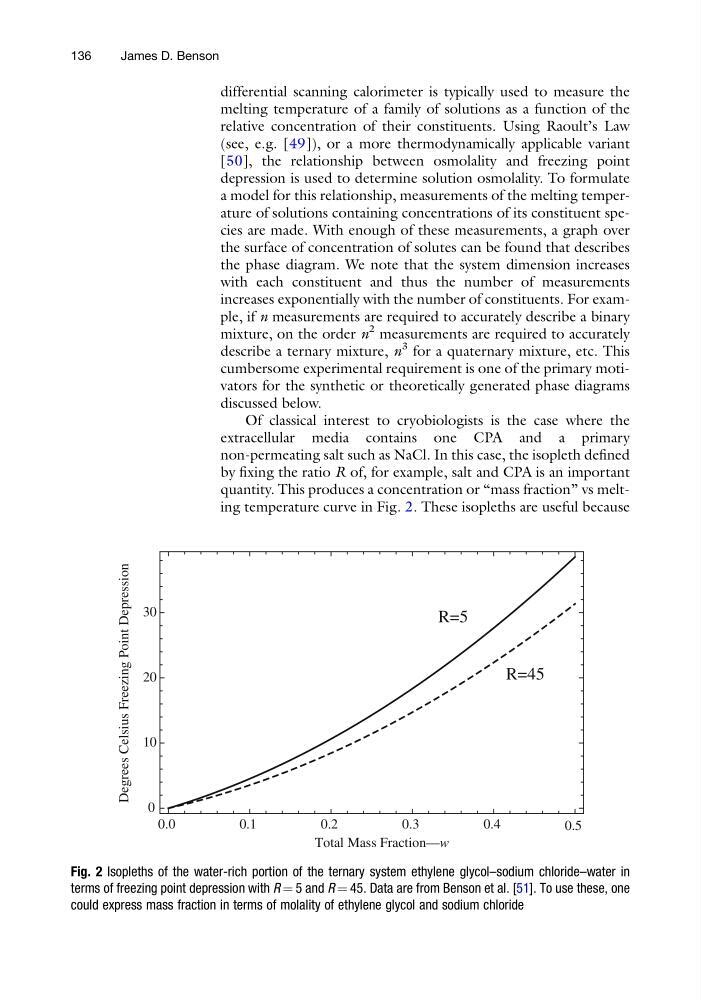
quantity. This produces a concentration or “mass fraction” vs melting temperature curve in Fig. 2. These isopleths are useful because
0.0
0.1
0.2
0.3
0.4
0.5
0
10
20
30
Total Mass Fraction—w
Degrees Celsius Freezing Point Depression
R=5
R=45
Fig. 2 Isopleths of the water-rich portion of the ternary system ethylene glycol–sodium chloride–water in
terms of freezing point depression with R ¼ 5 and R ¼ 45. Data are from Benson et al. [51]. To use these, one
could express mass fraction in terms of molality of ethylene glycol and sodium chloride
136
James D. Benson
melting temperature of a family of solutions as a function of the
relative concentration of their constituents. Using Raoult’s Law
(see, e.g. [49]), or a more thermodynamically applicable variant
[50], the relationship between osmolality and freezing point
depression is used to determine solution osmolality. To formulate
a model for this relationship, measurements of the melting temperature of solutions containing concentrations of its constituent species are made. With enough of these measurements, a graph over
the surface of concentration of solutes can be found that describes
the phase diagram. We note that the system dimension increases
with each constituent and thus the number of measurements
increases exponentially with the number of constituents. For example, if n measurements are required to accurately describe a binary
mixture, on the order n
2 measurements are required to accurately
describe a ternary mixture, n
3 for a quaternary mixture, etc. This
cumbersome experimental requirement is one of the primary motivators for the synthetic or theoretically generated phase diagrams
discussed below.
Of classical interest to cryobiologists is the case where the
extracellular media contains one CPA and a primary
non-permeating salt such as NaCl. In this case, the isopleth defined
by fixing the ratio R of, for example, salt and CPA is an important
quantity. This produces a concentration or “mass fraction” vs melting temperature curve in Fig. 2. These isopleths are useful because
0.0
0.1
0.2
0.3
0.4
0.5
0
10
20
30
Total Mass Fraction—w
Degrees Celsius Freezing Point Depression
R=5
R=45
Fig. 2 Isopleths of the water-rich portion of the ternary system ethylene glycol–sodium chloride–water in
terms of freezing point depression with R ¼ 5 and R ¼ 45. Data are from Benson et al. [51]. To use these, one
could express mass fraction in terms of molality of ethylene glycol and sodium chloride
136
James D. Benson