

76
2 The Interaction of Electromagnetic Waves with Water
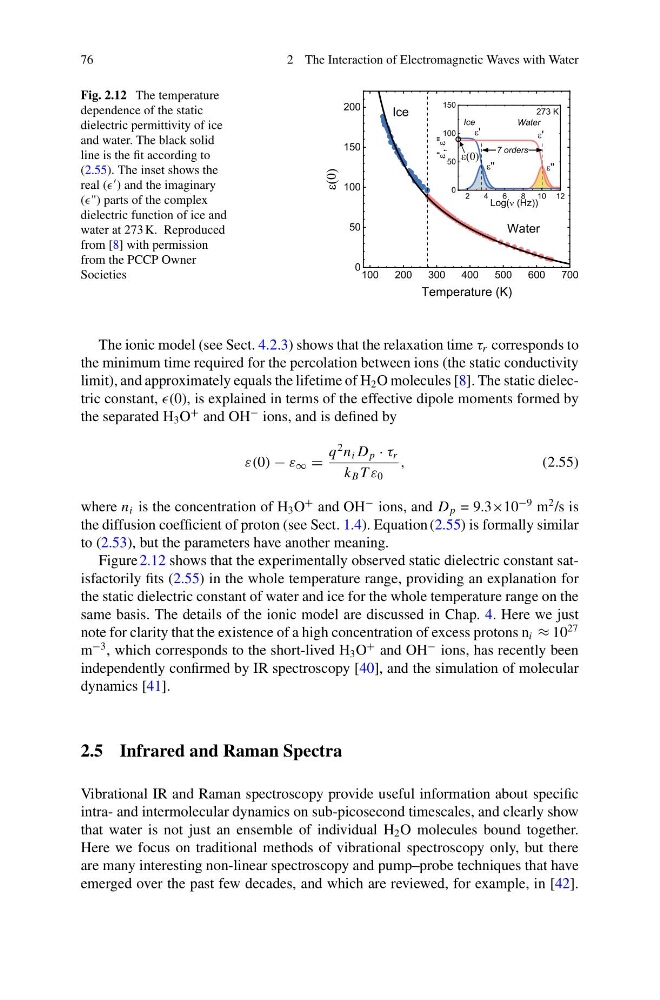
Fig. 2.12 The temperature
dependence of the static
dielectric permittivity of ice
and water. The black solid
line is the fit according to
(2.55). The inset shows the
real ( ) and the imaginary
(") parts of the complex
dielectric function of ice and
water at 273 K. Reproduced
from [8] with permission
from the PCCP Owner
Societies
The ionic model (see Sect. 4.2.3) shows that the relaxation time τ r corresponds to
the minimum time required for the percolation between ions (the static conductivity
limit), and approximately equals the lifetime of H 2 O molecules [8]. The static dielectric constant, (0), is explained in terms of the effective dipole moments formed by
the separated H 3 O
+ and OH
− ions, and is defined by
ε(0) − ε ∞ =
q
2 n i D p · τ r
k B T ε 0
,
(2.55)
where n i is the concentration of H 3 O
+ and OH
− ions, and D p = 9.3×10
−9 m
2 /s is
the diffusion coefficient of proton (see Sect. 1.4). Equation (2.55) is formally similar
to (2.53), but the parameters have another meaning.
Figure 2.12 shows that the experimentally observed static dielectric constant satisfactorily fits (2.55) in the whole temperature range, providing an explanation for
the static dielectric constant of water and ice for the whole temperature range on the
same basis. The details of the ionic model are discussed in Chap. 4. Here we just
note for clarity that the existence of a high concentration of excess protons n i ≈ 10
27
m
−3 , which corresponds to the short-lived H 3 O
+ and OH
− ions, has recently been
independently confirmed by IR spectroscopy [40], and the simulation of molecular
dynamics [41].
2.5 Infrared and Raman Spectra
Vibrational IR and Raman spectroscopy provide useful information about specific
intra- and intermolecular dynamics on sub-picosecond timescales, and clearly show
that water is not just an ensemble of individual H 2 O molecules bound together.
Here we focus on traditional methods of vibrational spectroscopy only, but there
are many interesting non-linear spectroscopy and pump–probe techniques that have
emerged over the past few decades, and which are reviewed, for example, in [42].
2 The Interaction of Electromagnetic Waves with Water
Fig. 2.12 The temperature
dependence of the static
dielectric permittivity of ice
and water. The black solid
line is the fit according to
(2.55). The inset shows the
real ( ) and the imaginary
(") parts of the complex
dielectric function of ice and
water at 273 K. Reproduced
from [8] with permission
from the PCCP Owner
Societies
The ionic model (see Sect. 4.2.3) shows that the relaxation time τ r corresponds to
the minimum time required for the percolation between ions (the static conductivity
limit), and approximately equals the lifetime of H 2 O molecules [8]. The static dielectric constant, (0), is explained in terms of the effective dipole moments formed by
the separated H 3 O
+ and OH
− ions, and is defined by
ε(0) − ε ∞ =
q
2 n i D p · τ r
k B T ε 0
,
(2.55)
where n i is the concentration of H 3 O
+ and OH
− ions, and D p = 9.3×10
−9 m
2 /s is
the diffusion coefficient of proton (see Sect. 1.4). Equation (2.55) is formally similar
to (2.53), but the parameters have another meaning.
Figure 2.12 shows that the experimentally observed static dielectric constant satisfactorily fits (2.55) in the whole temperature range, providing an explanation for
the static dielectric constant of water and ice for the whole temperature range on the
same basis. The details of the ionic model are discussed in Chap. 4. Here we just
note for clarity that the existence of a high concentration of excess protons n i ≈ 10
27
m
−3 , which corresponds to the short-lived H 3 O
+ and OH
− ions, has recently been
independently confirmed by IR spectroscopy [40], and the simulation of molecular
dynamics [41].
2.5 Infrared and Raman Spectra
Vibrational IR and Raman spectroscopy provide useful information about specific
intra- and intermolecular dynamics on sub-picosecond timescales, and clearly show
that water is not just an ensemble of individual H 2 O molecules bound together.
Here we focus on traditional methods of vibrational spectroscopy only, but there
are many interesting non-linear spectroscopy and pump–probe techniques that have
emerged over the past few decades, and which are reviewed, for example, in [42].