

2.3 Microwave Spectrum: Dielectric Relaxation
61
ε 4 (T ) = p 0 + p 1 (T − 273) + p 2 (T − 273)
2
, (2.32)
ω 4 (T )/2π = p 3 + p 4 (T − 273) + p 5 (T − 273)
2
+ p 6 (T − 273)
3
, (2.33)
τ 4 (T ) = p 7 + p 8 (T − 273) + p 9 (T − 273)
2
+ p 10 (T − 273)
3
, (2.34)
ε 5 (T ) = p 11 + p 12 (T − 273) + p 13 (T − 273)
2
, (2.35)
ω 5 (T )/2π = p 14 + p 15 (T − 273) + p 16 (T − 273)
2
, (2.36)
τ 5 (T ) = p 17 + p 18 (T − 273) + p 19 (T − 273)
2
. (2.37)
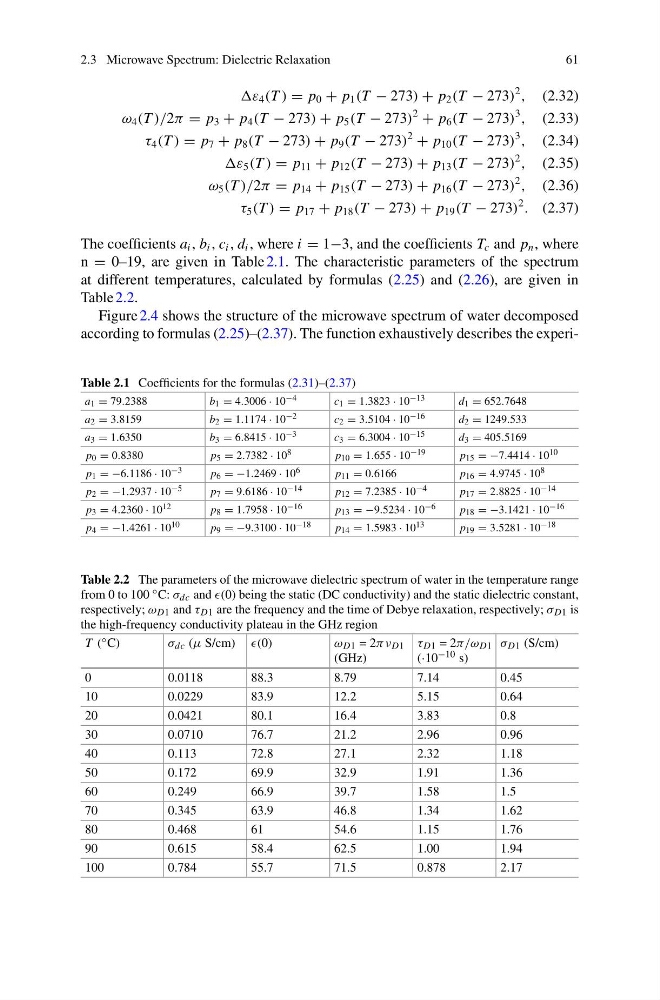
The coefficients a i , b i , c i , d i , where i = 1−3, and the coefficients T c and p n , where
n = 0–19, are given in Table 2.1. The characteristic parameters of the spectrum
at different temperatures, calculated by formulas (2.25) and (2.26), are given in
Table 2.2.
Figure 2.4 shows the structure of the microwave spectrum of water decomposed
according to formulas (2.25)–(2.37). The function exhaustively describes the experiTable 2.1 Coefficients for the formulas (2.31)–(2.37)
a 1 = 79.2388
b 1 = 4.3006 · 10 −4
c 1 = 1.3823 · 10 −13
d 1 = 652.7648
a 2 = 3.8159
b 2 = 1.1174 · 10 −2
c 2 = 3.5104 · 10 −16
d 2 = 1249.533
a 3 = 1.6350
b 3 = 6.8415 · 10 −3
c 3 = 6.3004 · 10 −15
d 3 = 405.5169
p 0 = 0.8380
p 5 = 2.7382 · 10 8
p 10 = 1.655 · 10 −19
p 15 = −7.4414 · 10 10
p 1 = −6.1186 · 10 −3
p 6 = −1.2469 · 10 6
p 11 = 0.6166
p 16 = 4.9745 · 10 8
p 2 = −1.2937 · 10 −5
p 7 = 9.6186 · 10 −14
p 12 = 7.2385 · 10 −4
p 17 = 2.8825 · 10 −14
p 3 = 4.2360 · 10 12
p 8 = 1.7958 · 10 −16
p 13 = −9.5234 · 10 −6
p 18 = −3.1421 · 10 −16
p 4 = −1.4261 · 10 10
p 9 = −9.3100 · 10 −18
p 14 = 1.5983 · 10 13
p 19 = 3.5281 · 10 −18
Table 2.2 The parameters of the microwave dielectric spectrum of water in the temperature range
from 0 to 100 ◦ C: σ dc and (0) being the static (DC conductivity) and the static dielectric constant,
respectively; ω D1 and τ D1 are the frequency and the time of Debye relaxation, respectively; σ D1 is
the high-frequency conductivity plateau in the GHz region
T ( ◦ C)
σ dc (μ S/cm) (0)
ω D1 = 2πν D1
(GHz)
τ D1 = 2π/ω D1
(·10 −10 s)
σ D1 (S/cm)
0
0.0118
88.3
8.79
7.14
0.45
10
0.0229
83.9
12.2
5.15
0.64
20
0.0421
80.1
16.4
3.83
0.8
30
0.0710
76.7
21.2
2.96
0.96
40
0.113
72.8
27.1
2.32
1.18
50
0.172
69.9
32.9
1.91
1.36
60
0.249
66.9
39.7
1.58
1.5
70
0.345
63.9
46.8
1.34
1.62
80
0.468
61
54.6
1.15
1.76
90
0.615
58.4
62.5
1.00
1.94
100
0.784
55.7
71.5
0.878
2.17
61
ε 4 (T ) = p 0 + p 1 (T − 273) + p 2 (T − 273)
2
, (2.32)
ω 4 (T )/2π = p 3 + p 4 (T − 273) + p 5 (T − 273)
2
+ p 6 (T − 273)
3
, (2.33)
τ 4 (T ) = p 7 + p 8 (T − 273) + p 9 (T − 273)
2
+ p 10 (T − 273)
3
, (2.34)
ε 5 (T ) = p 11 + p 12 (T − 273) + p 13 (T − 273)
2
, (2.35)
ω 5 (T )/2π = p 14 + p 15 (T − 273) + p 16 (T − 273)
2
, (2.36)
τ 5 (T ) = p 17 + p 18 (T − 273) + p 19 (T − 273)
2
. (2.37)
The coefficients a i , b i , c i , d i , where i = 1−3, and the coefficients T c and p n , where
n = 0–19, are given in Table 2.1. The characteristic parameters of the spectrum
at different temperatures, calculated by formulas (2.25) and (2.26), are given in
Table 2.2.
Figure 2.4 shows the structure of the microwave spectrum of water decomposed
according to formulas (2.25)–(2.37). The function exhaustively describes the experiTable 2.1 Coefficients for the formulas (2.31)–(2.37)
a 1 = 79.2388
b 1 = 4.3006 · 10 −4
c 1 = 1.3823 · 10 −13
d 1 = 652.7648
a 2 = 3.8159
b 2 = 1.1174 · 10 −2
c 2 = 3.5104 · 10 −16
d 2 = 1249.533
a 3 = 1.6350
b 3 = 6.8415 · 10 −3
c 3 = 6.3004 · 10 −15
d 3 = 405.5169
p 0 = 0.8380
p 5 = 2.7382 · 10 8
p 10 = 1.655 · 10 −19
p 15 = −7.4414 · 10 10
p 1 = −6.1186 · 10 −3
p 6 = −1.2469 · 10 6
p 11 = 0.6166
p 16 = 4.9745 · 10 8
p 2 = −1.2937 · 10 −5
p 7 = 9.6186 · 10 −14
p 12 = 7.2385 · 10 −4
p 17 = 2.8825 · 10 −14
p 3 = 4.2360 · 10 12
p 8 = 1.7958 · 10 −16
p 13 = −9.5234 · 10 −6
p 18 = −3.1421 · 10 −16
p 4 = −1.4261 · 10 10
p 9 = −9.3100 · 10 −18
p 14 = 1.5983 · 10 13
p 19 = 3.5281 · 10 −18
Table 2.2 The parameters of the microwave dielectric spectrum of water in the temperature range
from 0 to 100 ◦ C: σ dc and (0) being the static (DC conductivity) and the static dielectric constant,
respectively; ω D1 and τ D1 are the frequency and the time of Debye relaxation, respectively; σ D1 is
the high-frequency conductivity plateau in the GHz region
T ( ◦ C)
σ dc (μ S/cm) (0)
ω D1 = 2πν D1
(GHz)
τ D1 = 2π/ω D1
(·10 −10 s)
σ D1 (S/cm)
0
0.0118
88.3
8.79
7.14
0.45
10
0.0229
83.9
12.2
5.15
0.64
20
0.0421
80.1
16.4
3.83
0.8
30
0.0710
76.7
21.2
2.96
0.96
40
0.113
72.8
27.1
2.32
1.18
50
0.172
69.9
32.9
1.91
1.36
60
0.249
66.9
39.7
1.58
1.5
70
0.345
63.9
46.8
1.34
1.62
80
0.468
61
54.6
1.15
1.76
90
0.615
58.4
62.5
1.00
1.94
100
0.784
55.7
71.5
0.878
2.17