

62
2 The Interaction of Electromagnetic Waves with Water
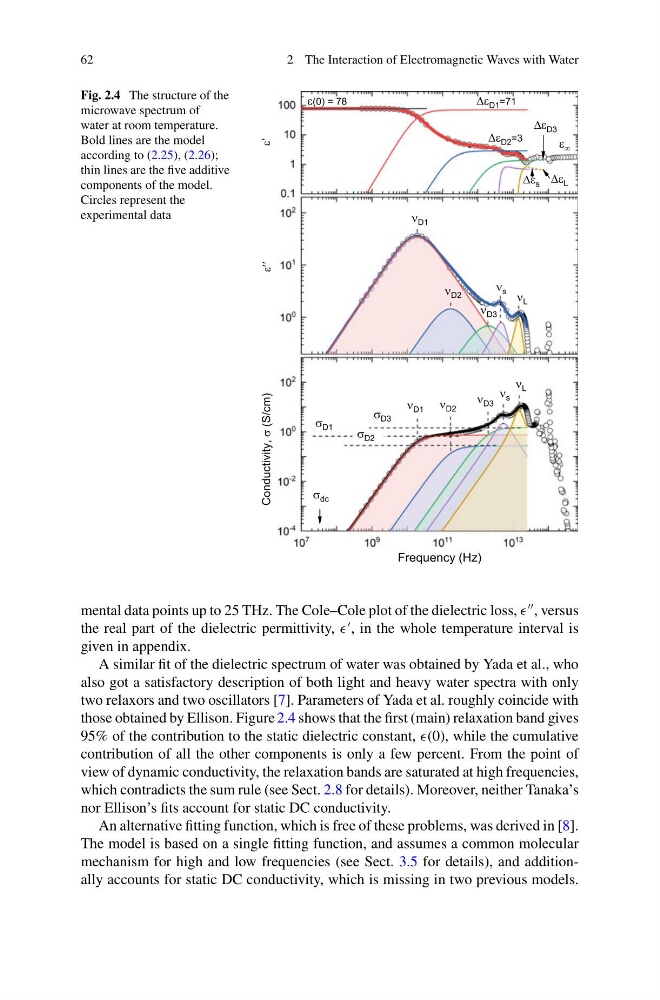
Fig. 2.4 The structure of the
microwave spectrum of
water at room temperature.
Bold lines are the model
according to (2.25), (2.26);
thin lines are the five additive
components of the model.
Circles represent the
experimental data
mental data points up to 25 THz. The Cole–Cole plot of the dielectric loss,
, versus
the real part of the dielectric permittivity,
, in the whole temperature interval is
given in appendix.
A similar fit of the dielectric spectrum of water was obtained by Yada et al., who
also got a satisfactory description of both light and heavy water spectra with only
two relaxors and two oscillators [7]. Parameters of Yada et al. roughly coincide with
those obtained by Ellison. Figure 2.4 shows that the first (main) relaxation band gives
95% of the contribution to the static dielectric constant, (0), while the cumulative
contribution of all the other components is only a few percent. From the point of
view of dynamic conductivity, the relaxation bands are saturated at high frequencies,
which contradicts the sum rule (see Sect. 2.8 for details). Moreover, neither Tanaka’s
nor Ellison’s fits account for static DC conductivity.
An alternative fitting function, which is free of these problems, was derived in [8].
The model is based on a single fitting function, and assumes a common molecular
mechanism for high and low frequencies (see Sect. 3.5 for details), and additionally accounts for static DC conductivity, which is missing in two previous models.
2 The Interaction of Electromagnetic Waves with Water
Fig. 2.4 The structure of the
microwave spectrum of
water at room temperature.
Bold lines are the model
according to (2.25), (2.26);
thin lines are the five additive
components of the model.
Circles represent the
experimental data
mental data points up to 25 THz. The Cole–Cole plot of the dielectric loss,
, versus
the real part of the dielectric permittivity,
, in the whole temperature interval is
given in appendix.
A similar fit of the dielectric spectrum of water was obtained by Yada et al., who
also got a satisfactory description of both light and heavy water spectra with only
two relaxors and two oscillators [7]. Parameters of Yada et al. roughly coincide with
those obtained by Ellison. Figure 2.4 shows that the first (main) relaxation band gives
95% of the contribution to the static dielectric constant, (0), while the cumulative
contribution of all the other components is only a few percent. From the point of
view of dynamic conductivity, the relaxation bands are saturated at high frequencies,
which contradicts the sum rule (see Sect. 2.8 for details). Moreover, neither Tanaka’s
nor Ellison’s fits account for static DC conductivity.
An alternative fitting function, which is free of these problems, was derived in [8].
The model is based on a single fitting function, and assumes a common molecular
mechanism for high and low frequencies (see Sect. 3.5 for details), and additionally accounts for static DC conductivity, which is missing in two previous models.