

28
1 A Historical Review of the Structures of Water and Ice
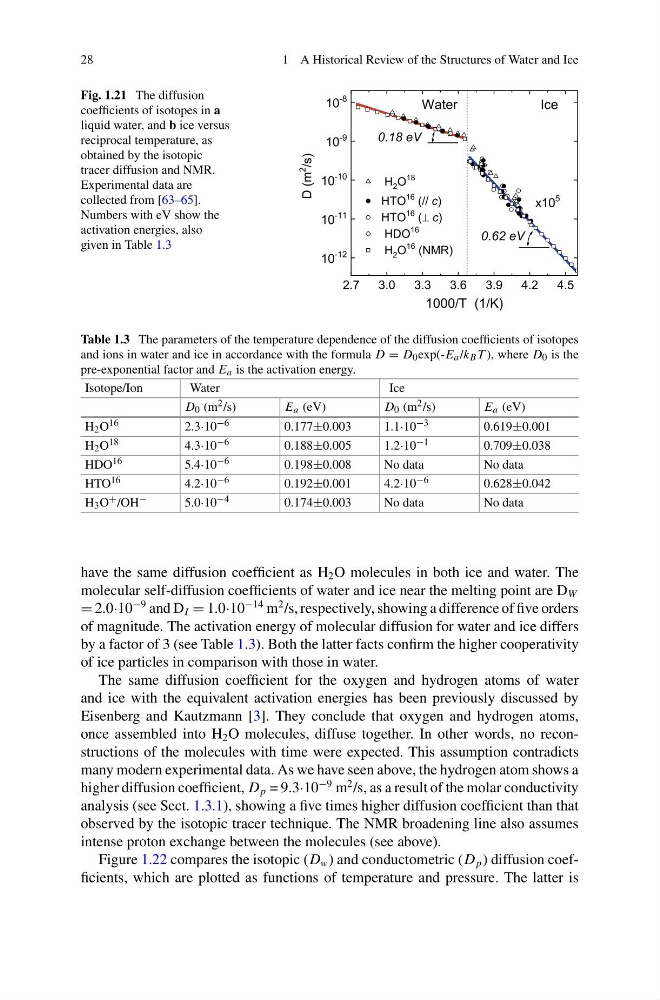
Fig. 1.21 The diffusion
coefficients of isotopes in a
liquid water, and b ice versus
reciprocal temperature, as
obtained by the isotopic
tracer diffusion and NMR.
Experimental data are
collected from [63–65].
Numbers with eV show the
activation energies, also
given in Table 1.3
Table 1.3 The parameters of the temperature dependence of the diffusion coefficients of isotopes
and ions in water and ice in accordance with the formula D = D 0 exp(-E a /k B T ), where D 0 is the
pre-exponential factor and E a is the activation energy.
Isotope/Ion
Water
Ice
D 0 (m 2 /s)
E a (eV)
D 0 (m 2 /s)
E a (eV)
H 2 O 16
2.3·10 −6
0.177±0.003
1.1·10 −3
0.619±0.001
H 2 O 18
4.3·10 −6
0.188±0.005
1.2·10 −1
0.709±0.038
HDO 16
5.4·10 −6
0.198±0.008
No data
No data
HTO 16
4.2·10 −6
0.192±0.001
4.2·10 −6
0.628±0.042
H 3 O + /OH −
5.0·10 −4
0.174±0.003
No data
No data
have the same diffusion coefficient as H 2 O molecules in both ice and water. The
molecular self-diffusion coefficients of water and ice near the melting point are D W
= 2.0·10
−9 and D I = 1.0·10
−14 m
2 /s, respectively, showing a difference of five orders
of magnitude. The activation energy of molecular diffusion for water and ice differs
by a factor of 3 (see Table 1.3). Both the latter facts confirm the higher cooperativity
of ice particles in comparison with those in water.
The same diffusion coefficient for the oxygen and hydrogen atoms of water
and ice with the equivalent activation energies has been previously discussed by
Eisenberg and Kautzmann [3]. They conclude that oxygen and hydrogen atoms,
once assembled into H 2 O molecules, diffuse together. In other words, no reconstructions of the molecules with time were expected. This assumption contradicts
many modern experimental data. As we have seen above, the hydrogen atom shows a
higher diffusion coefficient, D p = 9.3·10
−9 m
2 /s, as a result of the molar conductivity
analysis (see Sect. 1.3.1), showing a five times higher diffusion coefficient than that
observed by the isotopic tracer technique. The NMR broadening line also assumes
intense proton exchange between the molecules (see above).
Figure 1.22 compares the isotopic (D w ) and conductometric (D p ) diffusion coefficients, which are plotted as functions of temperature and pressure. The latter is
1 A Historical Review of the Structures of Water and Ice
Fig. 1.21 The diffusion
coefficients of isotopes in a
liquid water, and b ice versus
reciprocal temperature, as
obtained by the isotopic
tracer diffusion and NMR.
Experimental data are
collected from [63–65].
Numbers with eV show the
activation energies, also
given in Table 1.3
Table 1.3 The parameters of the temperature dependence of the diffusion coefficients of isotopes
and ions in water and ice in accordance with the formula D = D 0 exp(-E a /k B T ), where D 0 is the
pre-exponential factor and E a is the activation energy.
Isotope/Ion
Water
Ice
D 0 (m 2 /s)
E a (eV)
D 0 (m 2 /s)
E a (eV)
H 2 O 16
2.3·10 −6
0.177±0.003
1.1·10 −3
0.619±0.001
H 2 O 18
4.3·10 −6
0.188±0.005
1.2·10 −1
0.709±0.038
HDO 16
5.4·10 −6
0.198±0.008
No data
No data
HTO 16
4.2·10 −6
0.192±0.001
4.2·10 −6
0.628±0.042
H 3 O + /OH −
5.0·10 −4
0.174±0.003
No data
No data
have the same diffusion coefficient as H 2 O molecules in both ice and water. The
molecular self-diffusion coefficients of water and ice near the melting point are D W
= 2.0·10
−9 and D I = 1.0·10
−14 m
2 /s, respectively, showing a difference of five orders
of magnitude. The activation energy of molecular diffusion for water and ice differs
by a factor of 3 (see Table 1.3). Both the latter facts confirm the higher cooperativity
of ice particles in comparison with those in water.
The same diffusion coefficient for the oxygen and hydrogen atoms of water
and ice with the equivalent activation energies has been previously discussed by
Eisenberg and Kautzmann [3]. They conclude that oxygen and hydrogen atoms,
once assembled into H 2 O molecules, diffuse together. In other words, no reconstructions of the molecules with time were expected. This assumption contradicts
many modern experimental data. As we have seen above, the hydrogen atom shows a
higher diffusion coefficient, D p = 9.3·10
−9 m
2 /s, as a result of the molar conductivity
analysis (see Sect. 1.3.1), showing a five times higher diffusion coefficient than that
observed by the isotopic tracer technique. The NMR broadening line also assumes
intense proton exchange between the molecules (see above).
Figure 1.22 compares the isotopic (D w ) and conductometric (D p ) diffusion coefficients, which are plotted as functions of temperature and pressure. The latter is