

1.4 Self-diffusion by Isotopic Tracers
27
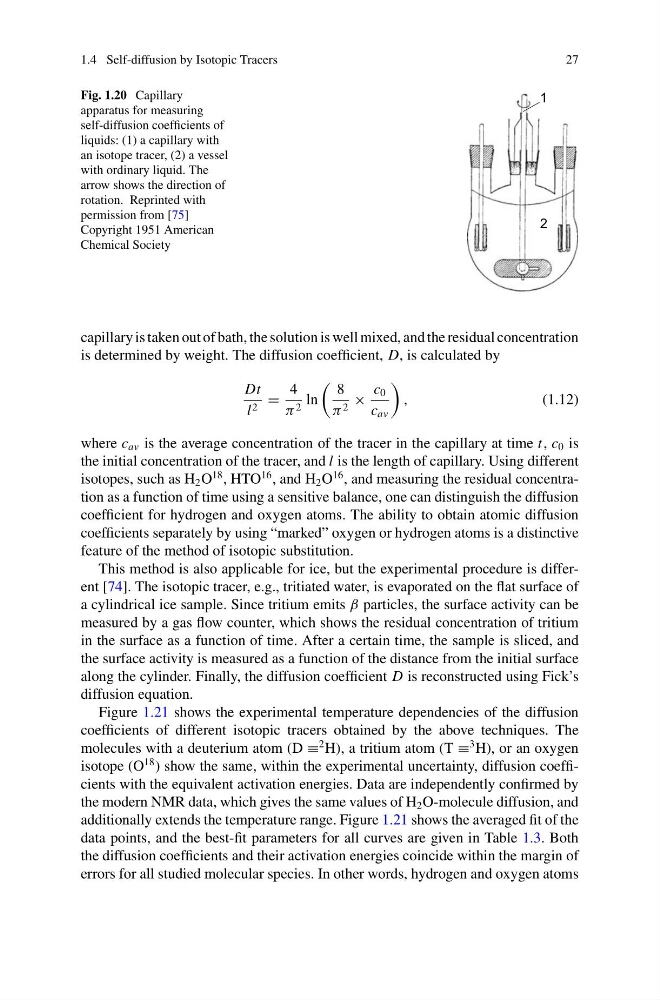
Fig. 1.20 Capillary
apparatus for measuring
self-diffusion coefficients of
liquids: (1) a capillary with
an isotope tracer, (2) a vessel
with ordinary liquid. The
arrow shows the direction of
rotation. Reprinted with
permission from [75]
Copyright 1951 American
Chemical Society
1
2
capillary is taken out of bath, the solution is well mixed, and the residual concentration
is determined by weight. The diffusion coefficient, D, is calculated by
Dt
l 2 =
4
π 2 ln
8
π 2 ×
c 0
c av
,
(1.12)
where c av is the average concentration of the tracer in the capillary at time t, c 0 is
the initial concentration of the tracer, and l is the length of capillary. Using different
isotopes, such as H 2 O
18 , HTO
16 , and H 2 O
16 , and measuring the residual concentration as a function of time using a sensitive balance, one can distinguish the diffusion
coefficient for hydrogen and oxygen atoms. The ability to obtain atomic diffusion
coefficients separately by using “marked” oxygen or hydrogen atoms is a distinctive
feature of the method of isotopic substitution.
This method is also applicable for ice, but the experimental procedure is different [74]. The isotopic tracer, e.g., tritiated water, is evaporated on the flat surface of
a cylindrical ice sample. Since tritium emits β particles, the surface activity can be
measured by a gas flow counter, which shows the residual concentration of tritium
in the surface as a function of time. After a certain time, the sample is sliced, and
the surface activity is measured as a function of the distance from the initial surface
along the cylinder. Finally, the diffusion coefficient D is reconstructed using Fick’s
diffusion equation.
Figure 1.21 shows the experimental temperature dependencies of the diffusion
coefficients of different isotopic tracers obtained by the above techniques. The
molecules with a deuterium atom (D ≡
2 H), a tritium atom (T ≡
3 H), or an oxygen
isotope (O
18 ) show the same, within the experimental uncertainty, diffusion coefficients with the equivalent activation energies. Data are independently confirmed by
the modern NMR data, which gives the same values of H 2 O-molecule diffusion, and
additionally extends the temperature range. Figure 1.21 shows the averaged fit of the
data points, and the best-fit parameters for all curves are given in Table 1.3. Both
the diffusion coefficients and their activation energies coincide within the margin of
errors for all studied molecular species. In other words, hydrogen and oxygen atoms
27
Fig. 1.20 Capillary
apparatus for measuring
self-diffusion coefficients of
liquids: (1) a capillary with
an isotope tracer, (2) a vessel
with ordinary liquid. The
arrow shows the direction of
rotation. Reprinted with
permission from [75]
Copyright 1951 American
Chemical Society
1
2
capillary is taken out of bath, the solution is well mixed, and the residual concentration
is determined by weight. The diffusion coefficient, D, is calculated by
Dt
l 2 =
4
π 2 ln
8
π 2 ×
c 0
c av
,
(1.12)
where c av is the average concentration of the tracer in the capillary at time t, c 0 is
the initial concentration of the tracer, and l is the length of capillary. Using different
isotopes, such as H 2 O
18 , HTO
16 , and H 2 O
16 , and measuring the residual concentration as a function of time using a sensitive balance, one can distinguish the diffusion
coefficient for hydrogen and oxygen atoms. The ability to obtain atomic diffusion
coefficients separately by using “marked” oxygen or hydrogen atoms is a distinctive
feature of the method of isotopic substitution.
This method is also applicable for ice, but the experimental procedure is different [74]. The isotopic tracer, e.g., tritiated water, is evaporated on the flat surface of
a cylindrical ice sample. Since tritium emits β particles, the surface activity can be
measured by a gas flow counter, which shows the residual concentration of tritium
in the surface as a function of time. After a certain time, the sample is sliced, and
the surface activity is measured as a function of the distance from the initial surface
along the cylinder. Finally, the diffusion coefficient D is reconstructed using Fick’s
diffusion equation.
Figure 1.21 shows the experimental temperature dependencies of the diffusion
coefficients of different isotopic tracers obtained by the above techniques. The
molecules with a deuterium atom (D ≡
2 H), a tritium atom (T ≡
3 H), or an oxygen
isotope (O
18 ) show the same, within the experimental uncertainty, diffusion coefficients with the equivalent activation energies. Data are independently confirmed by
the modern NMR data, which gives the same values of H 2 O-molecule diffusion, and
additionally extends the temperature range. Figure 1.21 shows the averaged fit of the
data points, and the best-fit parameters for all curves are given in Table 1.3. Both
the diffusion coefficients and their activation energies coincide within the margin of
errors for all studied molecular species. In other words, hydrogen and oxygen atoms