

12
1 A Historical Review of the Structures of Water and Ice
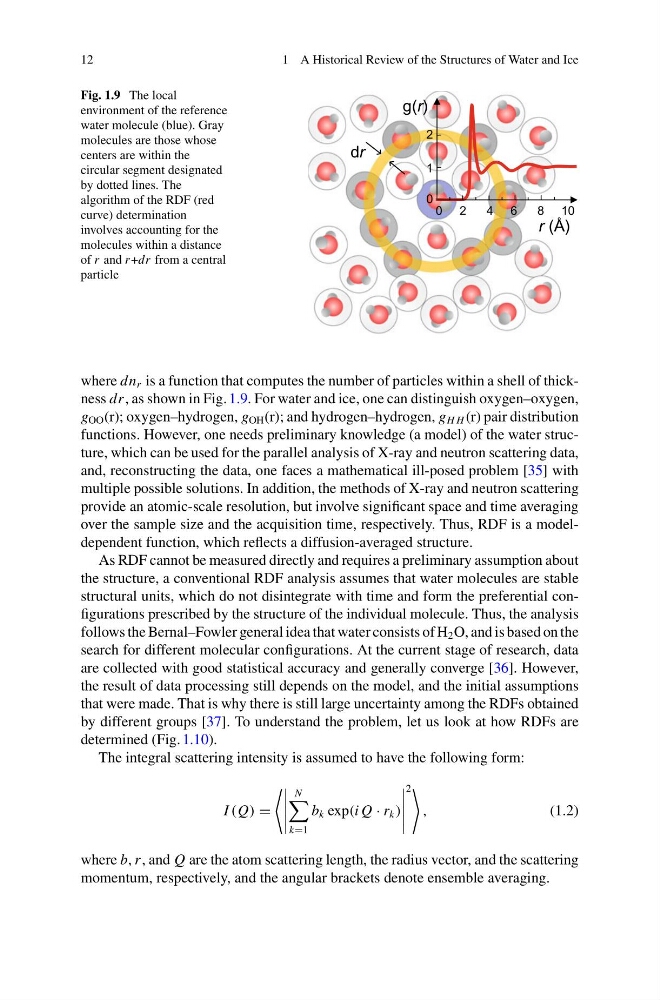
Fig. 1.9 The local
environment of the reference
water molecule (blue). Gray
molecules are those whose
centers are within the
circular segment designated
by dotted lines. The
algorithm of the RDF (red
curve) determination
involves accounting for the
molecules within a distance
of r and r +dr from a central
particle
dr
0 2
4 6
8 10
g(r)
r (Å)
1
0
2
where dn r is a function that computes the number of particles within a shell of thickness dr, as shown in Fig. 1.9. For water and ice, one can distinguish oxygen–oxygen,
g OO (r); oxygen–hydrogen, g OH (r); and hydrogen–hydrogen, g H H (r) pair distribution
functions. However, one needs preliminary knowledge (a model) of the water structure, which can be used for the parallel analysis of X-ray and neutron scattering data,
and, reconstructing the data, one faces a mathematical ill-posed problem [35] with
multiple possible solutions. In addition, the methods of X-ray and neutron scattering
provide an atomic-scale resolution, but involve significant space and time averaging
over the sample size and the acquisition time, respectively. Thus, RDF is a modeldependent function, which reflects a diffusion-averaged structure.
As RDF cannot be measured directly and requires a preliminary assumption about
the structure, a conventional RDF analysis assumes that water molecules are stable
structural units, which do not disintegrate with time and form the preferential configurations prescribed by the structure of the individual molecule. Thus, the analysis
follows the Bernal–Fowler general idea that water consists of H 2 O, and is based on the
search for different molecular configurations. At the current stage of research, data
are collected with good statistical accuracy and generally converge [36]. However,
the result of data processing still depends on the model, and the initial assumptions
that were made. That is why there is still large uncertainty among the RDFs obtained
by different groups [37]. To understand the problem, let us look at how RDFs are
determined (Fig. 1.10).
The integral scattering intensity is assumed to have the following form:
I (Q) =
N
k=1
b k exp(i Q · r k )
2
,
(1.2)
where b, r , and Q are the atom scattering length, the radius vector, and the scattering
momentum, respectively, and the angular brackets denote ensemble averaging.
1 A Historical Review of the Structures of Water and Ice
Fig. 1.9 The local
environment of the reference
water molecule (blue). Gray
molecules are those whose
centers are within the
circular segment designated
by dotted lines. The
algorithm of the RDF (red
curve) determination
involves accounting for the
molecules within a distance
of r and r +dr from a central
particle
dr
0 2
4 6
8 10
g(r)
r (Å)
1
0
2
where dn r is a function that computes the number of particles within a shell of thickness dr, as shown in Fig. 1.9. For water and ice, one can distinguish oxygen–oxygen,
g OO (r); oxygen–hydrogen, g OH (r); and hydrogen–hydrogen, g H H (r) pair distribution
functions. However, one needs preliminary knowledge (a model) of the water structure, which can be used for the parallel analysis of X-ray and neutron scattering data,
and, reconstructing the data, one faces a mathematical ill-posed problem [35] with
multiple possible solutions. In addition, the methods of X-ray and neutron scattering
provide an atomic-scale resolution, but involve significant space and time averaging
over the sample size and the acquisition time, respectively. Thus, RDF is a modeldependent function, which reflects a diffusion-averaged structure.
As RDF cannot be measured directly and requires a preliminary assumption about
the structure, a conventional RDF analysis assumes that water molecules are stable
structural units, which do not disintegrate with time and form the preferential configurations prescribed by the structure of the individual molecule. Thus, the analysis
follows the Bernal–Fowler general idea that water consists of H 2 O, and is based on the
search for different molecular configurations. At the current stage of research, data
are collected with good statistical accuracy and generally converge [36]. However,
the result of data processing still depends on the model, and the initial assumptions
that were made. That is why there is still large uncertainty among the RDFs obtained
by different groups [37]. To understand the problem, let us look at how RDFs are
determined (Fig. 1.10).
The integral scattering intensity is assumed to have the following form:
I (Q) =
N
k=1
b k exp(i Q · r k )
2
,
(1.2)
where b, r , and Q are the atom scattering length, the radius vector, and the scattering
momentum, respectively, and the angular brackets denote ensemble averaging.