

5.5 Water in a Strong Electric Field
203
Combining (5.22) and (5.24), we get the expression:
T = S H
2
ρg/8h,
(5.25)
which for H = 2 cm, h = 2 mm, and d = 2 mm (the real geometric parameters for the
experimentally observed bridge) gives T = 1.8×10
−3 N.
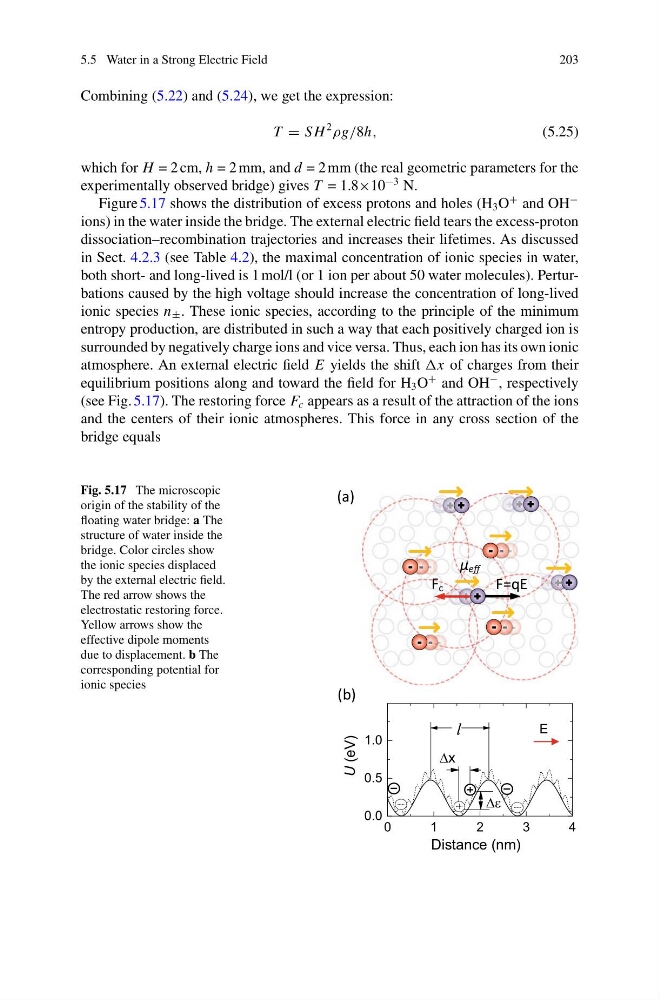
Figure 5.17 shows the distribution of excess protons and holes (H 3 O
+ and OH
−
ions) in the water inside the bridge. The external electric field tears the excess-proton
dissociation–recombination trajectories and increases their lifetimes. As discussed
in Sect. 4.2.3 (see Table 4.2), the maximal concentration of ionic species in water,
both short- and long-lived is 1 mol/l (or 1 ion per about 50 water molecules). Perturbations caused by the high voltage should increase the concentration of long-lived
ionic species n ± . These ionic species, according to the principle of the minimum
entropy production, are distributed in such a way that each positively charged ion is
surrounded by negatively charge ions and vice versa. Thus, each ion has its own ionic
atmosphere. An external electric field E yields the shift of charges from their
equilibrium positions along and toward the field for H 3 O
+ and OH
− , respectively
(see Fig. 5.17). The restoring force F c appears as a result of the attraction of the ions
and the centers of their ionic atmospheres. This force in any cross section of the
bridge equals
Fig. 5.17 The microscopic
origin of the stability of the
floating water bridge: a The
structure of water inside the
bridge. Color circles show
the ionic species displaced
by the external electric field.
The red arrow shows the
electrostatic restoring force.
Yellow arrows show the
effective dipole moments
due to displacement. b The
corresponding potential for
ionic species
- -
-
-
-
-
-
-
-
+
+
+
+
+
+
+
+
μ eff
F=qE
F c
(a)
(b)
0
1
2
3
4
0.0
0.5
1.0
Distance (nm)
E
U (eV)
l
203
Combining (5.22) and (5.24), we get the expression:
T = S H
2
ρg/8h,
(5.25)
which for H = 2 cm, h = 2 mm, and d = 2 mm (the real geometric parameters for the
experimentally observed bridge) gives T = 1.8×10
−3 N.
Figure 5.17 shows the distribution of excess protons and holes (H 3 O
+ and OH
−
ions) in the water inside the bridge. The external electric field tears the excess-proton
dissociation–recombination trajectories and increases their lifetimes. As discussed
in Sect. 4.2.3 (see Table 4.2), the maximal concentration of ionic species in water,
both short- and long-lived is 1 mol/l (or 1 ion per about 50 water molecules). Perturbations caused by the high voltage should increase the concentration of long-lived
ionic species n ± . These ionic species, according to the principle of the minimum
entropy production, are distributed in such a way that each positively charged ion is
surrounded by negatively charge ions and vice versa. Thus, each ion has its own ionic
atmosphere. An external electric field E yields the shift of charges from their
equilibrium positions along and toward the field for H 3 O
+ and OH
− , respectively
(see Fig. 5.17). The restoring force F c appears as a result of the attraction of the ions
and the centers of their ionic atmospheres. This force in any cross section of the
bridge equals
Fig. 5.17 The microscopic
origin of the stability of the
floating water bridge: a The
structure of water inside the
bridge. Color circles show
the ionic species displaced
by the external electric field.
The red arrow shows the
electrostatic restoring force.
Yellow arrows show the
effective dipole moments
due to displacement. b The
corresponding potential for
ionic species
- -
-
-
-
-
-
-
-
+
+
+
+
+
+
+
+
μ eff
F=qE
F c
(a)
(b)
0
1
2
3
4
0.0
0.5
1.0
Distance (nm)
E
U (eV)
l