

118
3 The Interaction of Electromagnetic Waves with Ice
Table 3.4 The fit parameters of the spectra from Fig. 3.8 according to (3.6). Additionally, = 95
and 88; ∞ = 2.2 and 2.5; σ dc = 0.16 and 1.2 µS/m for ice and water, respectively,
j
j
ν j (THz)
γ j (THz)
σ j (S/m)
Ice
1
2
92.2
1.12
0.6
5.7
2.4·10 6
2.9
4.1·10 −5
628
Water
1
(1 )
2
83.4
(2.1)
1.15
0.09
(1.7)
5.0
0.82
(4.5)
4.3
40
(76)
372
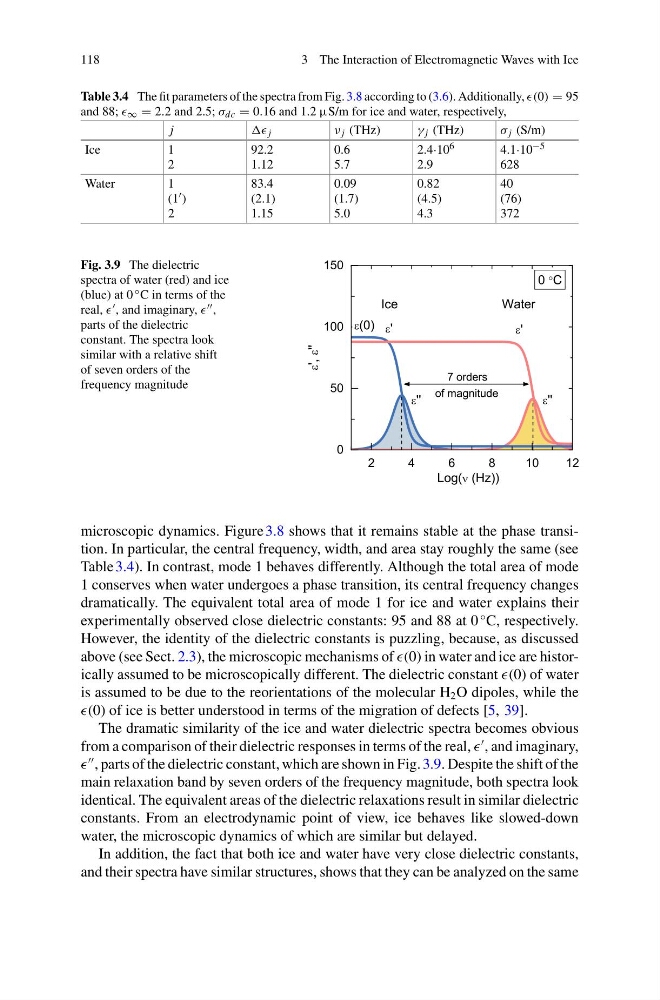
Fig. 3.9 The dielectric
spectra of water (red) and ice
(blue) at 0 ◦ C in terms of the
real, , and imaginary, ,
parts of the dielectric
constant. The spectra look
similar with a relative shift
of seven orders of the
frequency magnitude
microscopic dynamics. Figure 3.8 shows that it remains stable at the phase transition. In particular, the central frequency, width, and area stay roughly the same (see
Table 3.4). In contrast, mode 1 behaves differently. Although the total area of mode
1 conserves when water undergoes a phase transition, its central frequency changes
dramatically. The equivalent total area of mode 1 for ice and water explains their
experimentally observed close dielectric constants: 95 and 88 at 0
◦ C, respectively.
However, the identity of the dielectric constants is puzzling, because, as discussed
above (see Sect. 2.3), the microscopic mechanisms of (0) in water and ice are historically assumed to be microscopically different. The dielectric constant (0) of water
is assumed to be due to the reorientations of the molecular H 2 O dipoles, while the
(0) of ice is better understood in terms of the migration of defects [5, 39].
The dramatic similarity of the ice and water dielectric spectra becomes obvious
from a comparison of their dielectric responses in terms of the real,
, and imaginary,
, parts of the dielectric constant, which are shown in Fig. 3.9. Despite the shift of the
main relaxation band by seven orders of the frequency magnitude, both spectra look
identical. The equivalent areas of the dielectric relaxations result in similar dielectric
constants. From an electrodynamic point of view, ice behaves like slowed-down
water, the microscopic dynamics of which are similar but delayed.
In addition, the fact that both ice and water have very close dielectric constants,
and their spectra have similar structures, shows that they can be analyzed on the same
3 The Interaction of Electromagnetic Waves with Ice
Table 3.4 The fit parameters of the spectra from Fig. 3.8 according to (3.6). Additionally, = 95
and 88; ∞ = 2.2 and 2.5; σ dc = 0.16 and 1.2 µS/m for ice and water, respectively,
j
j
ν j (THz)
γ j (THz)
σ j (S/m)
Ice
1
2
92.2
1.12
0.6
5.7
2.4·10 6
2.9
4.1·10 −5
628
Water
1
(1 )
2
83.4
(2.1)
1.15
0.09
(1.7)
5.0
0.82
(4.5)
4.3
40
(76)
372
Fig. 3.9 The dielectric
spectra of water (red) and ice
(blue) at 0 ◦ C in terms of the
real, , and imaginary, ,
parts of the dielectric
constant. The spectra look
similar with a relative shift
of seven orders of the
frequency magnitude
microscopic dynamics. Figure 3.8 shows that it remains stable at the phase transition. In particular, the central frequency, width, and area stay roughly the same (see
Table 3.4). In contrast, mode 1 behaves differently. Although the total area of mode
1 conserves when water undergoes a phase transition, its central frequency changes
dramatically. The equivalent total area of mode 1 for ice and water explains their
experimentally observed close dielectric constants: 95 and 88 at 0
◦ C, respectively.
However, the identity of the dielectric constants is puzzling, because, as discussed
above (see Sect. 2.3), the microscopic mechanisms of (0) in water and ice are historically assumed to be microscopically different. The dielectric constant (0) of water
is assumed to be due to the reorientations of the molecular H 2 O dipoles, while the
(0) of ice is better understood in terms of the migration of defects [5, 39].
The dramatic similarity of the ice and water dielectric spectra becomes obvious
from a comparison of their dielectric responses in terms of the real,
, and imaginary,
, parts of the dielectric constant, which are shown in Fig. 3.9. Despite the shift of the
main relaxation band by seven orders of the frequency magnitude, both spectra look
identical. The equivalent areas of the dielectric relaxations result in similar dielectric
constants. From an electrodynamic point of view, ice behaves like slowed-down
water, the microscopic dynamics of which are similar but delayed.
In addition, the fact that both ice and water have very close dielectric constants,
and their spectra have similar structures, shows that they can be analyzed on the same