

3.3 Ice Among Other Dielectrics
115
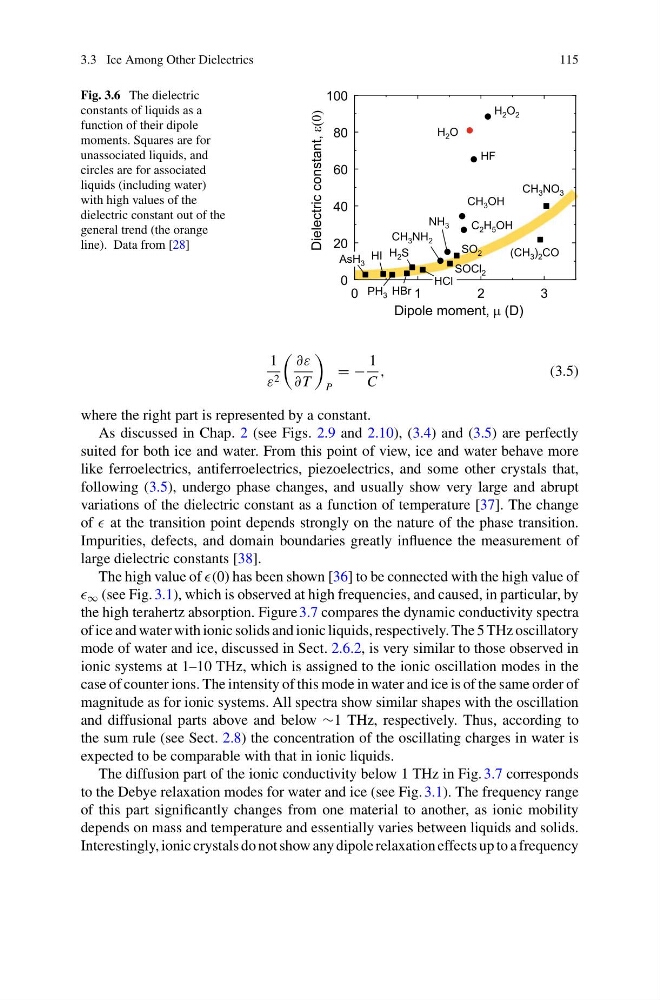
Fig. 3.6 The dielectric
constants of liquids as a
function of their dipole
moments. Squares are for
unassociated liquids, and
circles are for associated
liquids (including water)
with high values of the
dielectric constant out of the
general trend (the orange
line). Data from [28]
1
ε 2
∂ε
∂ T
P
= −
1
C
,
(3.5)
where the right part is represented by a constant.
As discussed in Chap. 2 (see Figs. 2.9 and 2.10), (3.4) and (3.5) are perfectly
suited for both ice and water. From this point of view, ice and water behave more
like ferroelectrics, antiferroelectrics, piezoelectrics, and some other crystals that,
following (3.5), undergo phase changes, and usually show very large and abrupt
variations of the dielectric constant as a function of temperature [37]. The change
of at the transition point depends strongly on the nature of the phase transition.
Impurities, defects, and domain boundaries greatly influence the measurement of
large dielectric constants [38].
The high value of (0) has been shown [36] to be connected with the high value of
∞ (see Fig. 3.1), which is observed at high frequencies, and caused, in particular, by
the high terahertz absorption. Figure 3.7 compares the dynamic conductivity spectra
of ice and water with ionic solids and ionic liquids, respectively. The 5 THz oscillatory
mode of water and ice, discussed in Sect. 2.6.2, is very similar to those observed in
ionic systems at 1–10 THz, which is assigned to the ionic oscillation modes in the
case of counter ions. The intensity of this mode in water and ice is of the same order of
magnitude as for ionic systems. All spectra show similar shapes with the oscillation
and diffusional parts above and below ∼1 THz, respectively. Thus, according to
the sum rule (see Sect. 2.8) the concentration of the oscillating charges in water is
expected to be comparable with that in ionic liquids.
The diffusion part of the ionic conductivity below 1 THz in Fig. 3.7 corresponds
to the Debye relaxation modes for water and ice (see Fig. 3.1). The frequency range
of this part significantly changes from one material to another, as ionic mobility
depends on mass and temperature and essentially varies between liquids and solids.
Interestingly, ionic crystals do not show any dipole relaxation effects up to a frequency
115
Fig. 3.6 The dielectric
constants of liquids as a
function of their dipole
moments. Squares are for
unassociated liquids, and
circles are for associated
liquids (including water)
with high values of the
dielectric constant out of the
general trend (the orange
line). Data from [28]
1
ε 2
∂ε
∂ T
P
= −
1
C
,
(3.5)
where the right part is represented by a constant.
As discussed in Chap. 2 (see Figs. 2.9 and 2.10), (3.4) and (3.5) are perfectly
suited for both ice and water. From this point of view, ice and water behave more
like ferroelectrics, antiferroelectrics, piezoelectrics, and some other crystals that,
following (3.5), undergo phase changes, and usually show very large and abrupt
variations of the dielectric constant as a function of temperature [37]. The change
of at the transition point depends strongly on the nature of the phase transition.
Impurities, defects, and domain boundaries greatly influence the measurement of
large dielectric constants [38].
The high value of (0) has been shown [36] to be connected with the high value of
∞ (see Fig. 3.1), which is observed at high frequencies, and caused, in particular, by
the high terahertz absorption. Figure 3.7 compares the dynamic conductivity spectra
of ice and water with ionic solids and ionic liquids, respectively. The 5 THz oscillatory
mode of water and ice, discussed in Sect. 2.6.2, is very similar to those observed in
ionic systems at 1–10 THz, which is assigned to the ionic oscillation modes in the
case of counter ions. The intensity of this mode in water and ice is of the same order of
magnitude as for ionic systems. All spectra show similar shapes with the oscillation
and diffusional parts above and below ∼1 THz, respectively. Thus, according to
the sum rule (see Sect. 2.8) the concentration of the oscillating charges in water is
expected to be comparable with that in ionic liquids.
The diffusion part of the ionic conductivity below 1 THz in Fig. 3.7 corresponds
to the Debye relaxation modes for water and ice (see Fig. 3.1). The frequency range
of this part significantly changes from one material to another, as ionic mobility
depends on mass and temperature and essentially varies between liquids and solids.
Interestingly, ionic crystals do not show any dipole relaxation effects up to a frequency