

90
2 The Interaction of Electromagnetic Waves with Water
and the main relaxation band ν D1 is a result of the finite lifetime of ionic species
(dielectric losses go down when the period of the external electric field exceeds the
lifetime of the ionic species). The details of the ionic model are discussed in Chap. 4.
2.7 Heavy Water: H/D Isotope Effect
The atomic-molecular dynamics of water can be effectively tested by isotopic substitution. This assumes the replacement of one or several atoms by their isotopes, and
a subsequent analysis of the transformation of the dielectric response. The simplest
way to analyze the isotope effect on the spectrum is to compare the dielectric response
of light (H 2 O) and heavy (D 2 O) water. Below we discuss the isotope effect in the
relaxation (dielectric spectrum) and oscillation (IR spectrum) parts of the dielectric
response or water.
2.7.1 Dielectric Spectrum: Intermolecular Dynamics
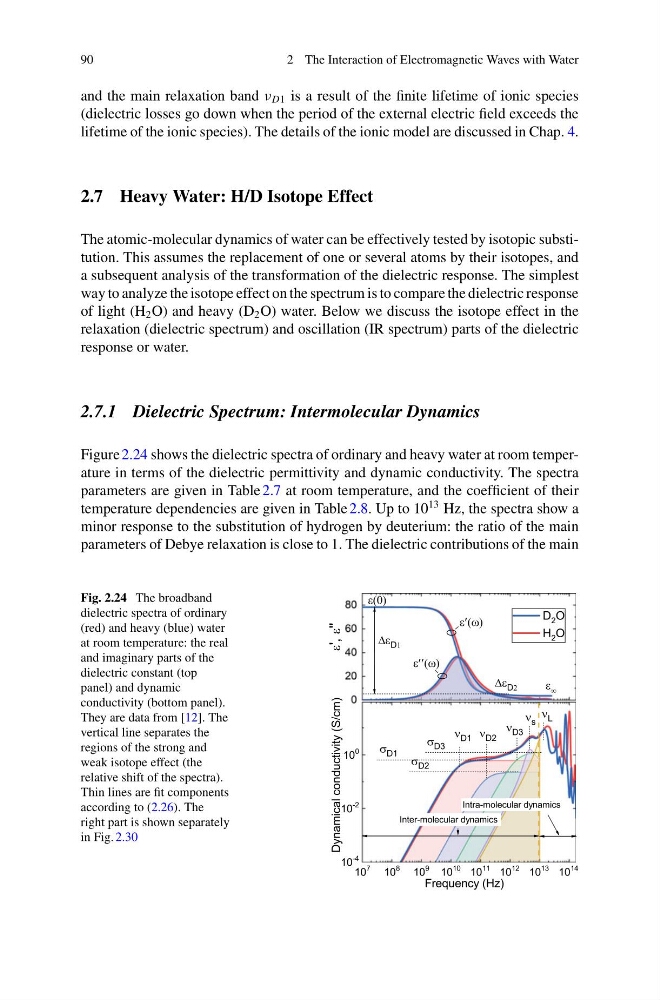
Figure 2.24 shows the dielectric spectra of ordinary and heavy water at room temperature in terms of the dielectric permittivity and dynamic conductivity. The spectra
parameters are given in Table 2.7 at room temperature, and the coefficient of their
temperature dependencies are given in Table 2.8. Up to 10
13 Hz, the spectra show a
minor response to the substitution of hydrogen by deuterium: the ratio of the main
parameters of Debye relaxation is close to 1. The dielectric contributions of the main
Fig. 2.24 The broadband
dielectric spectra of ordinary
(red) and heavy (blue) water
at room temperature: the real
and imaginary parts of the
dielectric constant (top
panel) and dynamic
conductivity (bottom panel).
They are data from [12]. The
vertical line separates the
regions of the strong and
weak isotope effect (the
relative shift of the spectra).
Thin lines are fit components
according to (2.26). The
right part is shown separately
in Fig. 2.30
2 The Interaction of Electromagnetic Waves with Water
and the main relaxation band ν D1 is a result of the finite lifetime of ionic species
(dielectric losses go down when the period of the external electric field exceeds the
lifetime of the ionic species). The details of the ionic model are discussed in Chap. 4.
2.7 Heavy Water: H/D Isotope Effect
The atomic-molecular dynamics of water can be effectively tested by isotopic substitution. This assumes the replacement of one or several atoms by their isotopes, and
a subsequent analysis of the transformation of the dielectric response. The simplest
way to analyze the isotope effect on the spectrum is to compare the dielectric response
of light (H 2 O) and heavy (D 2 O) water. Below we discuss the isotope effect in the
relaxation (dielectric spectrum) and oscillation (IR spectrum) parts of the dielectric
response or water.
2.7.1 Dielectric Spectrum: Intermolecular Dynamics
Figure 2.24 shows the dielectric spectra of ordinary and heavy water at room temperature in terms of the dielectric permittivity and dynamic conductivity. The spectra
parameters are given in Table 2.7 at room temperature, and the coefficient of their
temperature dependencies are given in Table 2.8. Up to 10
13 Hz, the spectra show a
minor response to the substitution of hydrogen by deuterium: the ratio of the main
parameters of Debye relaxation is close to 1. The dielectric contributions of the main
Fig. 2.24 The broadband
dielectric spectra of ordinary
(red) and heavy (blue) water
at room temperature: the real
and imaginary parts of the
dielectric constant (top
panel) and dynamic
conductivity (bottom panel).
They are data from [12]. The
vertical line separates the
regions of the strong and
weak isotope effect (the
relative shift of the spectra).
Thin lines are fit components
according to (2.26). The
right part is shown separately
in Fig. 2.30