

321
l
x(t)
y(t)
Water Tissue Water
Electric
pulse generator
Electric
pulse detector
Receiver
y a (t)
Transmitter
x a (t)
z 1 (t) z 2 (t) z 3 (t) z 4 (t)
l W 1
l W 2
Ultrasound Imaging
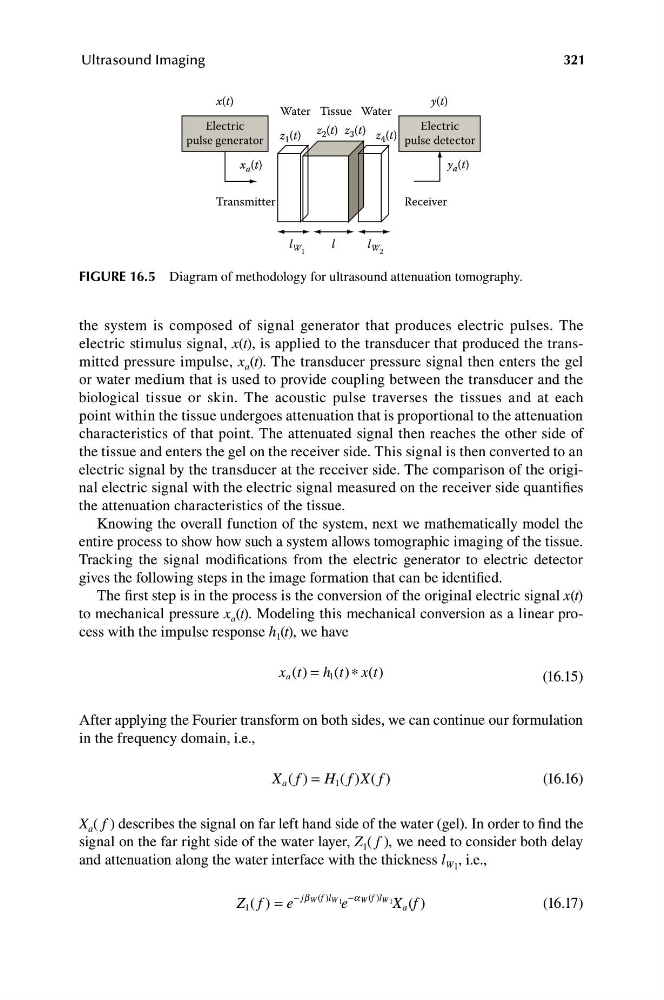
FIGURE 16.5 Diagram of methodology for ultrasound attenuation tomography.
the system is composed of signal generator that produces electric pulses. The
electric stimulus signal, x(t), is applied to the transducer that produced the transmitted pressure impulse, x a (t). The transducer pressure signal then enters the gel
or water medium that is used to provide coupling between the transducer and the
biological tissue or skin. The acoustic pulse traverses the tissues and at each
point within the tissue undergoes attenuation that is proportional to the attenuation
characteristics of that point. The attenuated signal then reaches the other side of
the tissue and enters the gel on the receiver side. This signal is then converted to an
electric signal by the transducer at the receiver side. The comparison of the original electric signal with the electric signal measured on the receiver side quantifies
the attenuation characteristics of the tissue.
Knowing the overall function of the system, next we mathematically model the
entire process to show how such a system allows tomographic imaging of the tissue.
Tracking the signal modifications from the electric generator to electric detector
gives the following steps in the image formation that can be identified.
The first step is in the process is the conversion of the original electric signal x(t)
to mechanical pressure x a (t). Modeling this mechanical conversion as a linear process with the impulse response h 1 (t), we have
x t = h ( )∗ t
a ( ) 1 t x( )
(16.15)
After applying the Fourier transform on both sides, we can continue our formulation
in the frequency domain, i.e.,
X f
a ( ) = H f X f
( )
(16.16)
1 ( )
X a ( f ) describes the signal on far left hand side of the water (gel). In order to find the
signal on the far right side of the water layer, Z 1 ( f ), we need to consider both delay
and attenuation along the water interface with the thickness l W1 , i.e.,
Z f
1 ( ) = e
− jb ( )
f l 1 e
−a ( )
f l 1 X f
( )
W
W
W
W
a
(16.17)
l
x(t)
y(t)
Water Tissue Water
Electric
pulse generator
Electric
pulse detector
Receiver
y a (t)
Transmitter
x a (t)
z 1 (t) z 2 (t) z 3 (t) z 4 (t)
l W 1
l W 2
Ultrasound Imaging
FIGURE 16.5 Diagram of methodology for ultrasound attenuation tomography.
the system is composed of signal generator that produces electric pulses. The
electric stimulus signal, x(t), is applied to the transducer that produced the transmitted pressure impulse, x a (t). The transducer pressure signal then enters the gel
or water medium that is used to provide coupling between the transducer and the
biological tissue or skin. The acoustic pulse traverses the tissues and at each
point within the tissue undergoes attenuation that is proportional to the attenuation
characteristics of that point. The attenuated signal then reaches the other side of
the tissue and enters the gel on the receiver side. This signal is then converted to an
electric signal by the transducer at the receiver side. The comparison of the original electric signal with the electric signal measured on the receiver side quantifies
the attenuation characteristics of the tissue.
Knowing the overall function of the system, next we mathematically model the
entire process to show how such a system allows tomographic imaging of the tissue.
Tracking the signal modifications from the electric generator to electric detector
gives the following steps in the image formation that can be identified.
The first step is in the process is the conversion of the original electric signal x(t)
to mechanical pressure x a (t). Modeling this mechanical conversion as a linear process with the impulse response h 1 (t), we have
x t = h ( )∗ t
a ( ) 1 t x( )
(16.15)
After applying the Fourier transform on both sides, we can continue our formulation
in the frequency domain, i.e.,
X f
a ( ) = H f X f
( )
(16.16)
1 ( )
X a ( f ) describes the signal on far left hand side of the water (gel). In order to find the
signal on the far right side of the water layer, Z 1 ( f ), we need to consider both delay
and attenuation along the water interface with the thickness l W1 , i.e.,
Z f
1 ( ) = e
− jb ( )
f l 1 e
−a ( )
f l 1 X f
( )
W
W
W
W
a
(16.17)