

177
Electrocardiogram
The electrocardiography made its introduction through the pioneering efforts of
the Dutch scientist Willem Einthoven in 1903. He used a galvanometer to design a
way to record the action potentials. He also introduced the markers P, Q, R, S, and
T on the standard ECG. The initial ECGs were recorded directly on paper and, in
fact, still are in many clinical cardiac electrophysiology laboratories. The galvanometer was directly coupled to an ink pen. This way, a voltage leading to a deflection
of the galvanometer would move or direct the pen over the paper. Each individual
electrode had its own galvanometer and separate ink pen. This method still stands as
the gold standard for analog recordings. However, nowadays, as described later, the
electrodes are connected to amplifiers and filters.
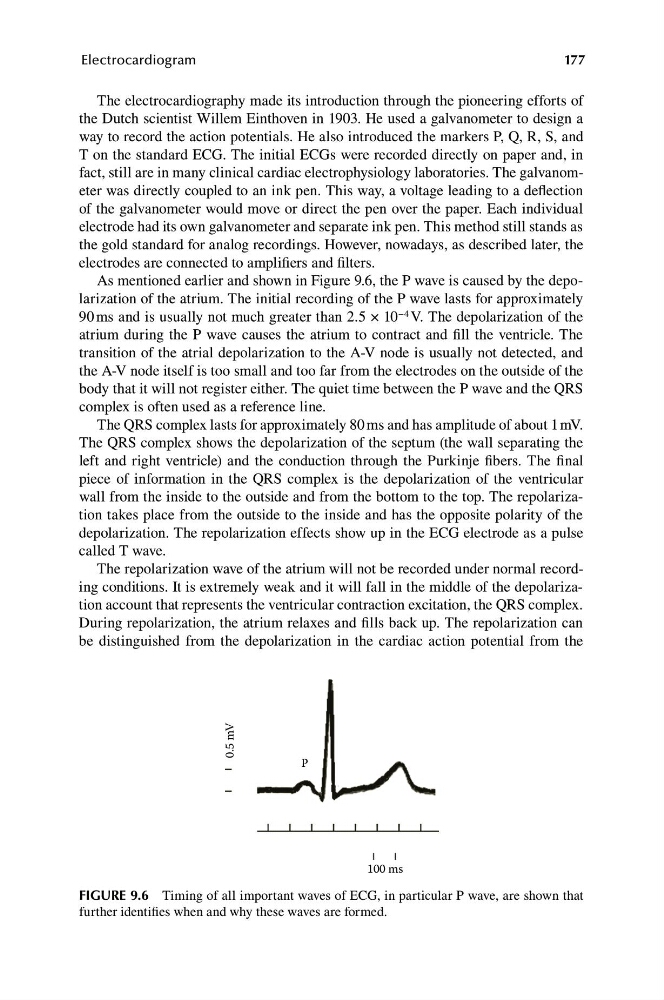
As mentioned earlier and shown in Figure 9.6, the P wave is caused by the depolarization of the atrium. The initial recording of the P wave lasts for approximately
90 ms and is usually not much greater than 2.5 × 10 −4 V. The depolarization of the
atrium during the P wave causes the atrium to contract and fill the ventricle. The
transition of the atrial depolarization to the A-V node is usually not detected, and
the A-V node itself is too small and too far from the electrodes on the outside of the
body that it will not register either. The quiet time between the P wave and the QRS
complex is often used as a reference line.
The QRS complex lasts for approximately 80 ms and has amplitude of about 1 mV.
The QRS complex shows the depolarization of the septum (the wall separating the
left and right ventricle) and the conduction through the Purkinje fibers. The final
piece of information in the QRS complex is the depolarization of the ventricular
wall from the inside to the outside and from the bottom to the top. The repolarization takes place from the outside to the inside and has the opposite polarity of the
depolarization. The repolarization effects show up in the ECG electrode as a pulse
called T wave.
The repolarization wave of the atrium will not be recorded under normal recording conditions. It is extremely weak and it will fall in the middle of the depolarization account that represents the ventricular contraction excitation, the QRS complex.
During repolarization, the atrium relaxes and fills back up. The repolarization can
be distinguished from the depolarization in the cardiac action potential from the
P
0.5 mV
100 ms
FIGURE 9.6 Timing of all important waves of ECG, in particular P wave, are shown that
further identifies when and why these waves are formed.
Electrocardiogram
The electrocardiography made its introduction through the pioneering efforts of
the Dutch scientist Willem Einthoven in 1903. He used a galvanometer to design a
way to record the action potentials. He also introduced the markers P, Q, R, S, and
T on the standard ECG. The initial ECGs were recorded directly on paper and, in
fact, still are in many clinical cardiac electrophysiology laboratories. The galvanometer was directly coupled to an ink pen. This way, a voltage leading to a deflection
of the galvanometer would move or direct the pen over the paper. Each individual
electrode had its own galvanometer and separate ink pen. This method still stands as
the gold standard for analog recordings. However, nowadays, as described later, the
electrodes are connected to amplifiers and filters.
As mentioned earlier and shown in Figure 9.6, the P wave is caused by the depolarization of the atrium. The initial recording of the P wave lasts for approximately
90 ms and is usually not much greater than 2.5 × 10 −4 V. The depolarization of the
atrium during the P wave causes the atrium to contract and fill the ventricle. The
transition of the atrial depolarization to the A-V node is usually not detected, and
the A-V node itself is too small and too far from the electrodes on the outside of the
body that it will not register either. The quiet time between the P wave and the QRS
complex is often used as a reference line.
The QRS complex lasts for approximately 80 ms and has amplitude of about 1 mV.
The QRS complex shows the depolarization of the septum (the wall separating the
left and right ventricle) and the conduction through the Purkinje fibers. The final
piece of information in the QRS complex is the depolarization of the ventricular
wall from the inside to the outside and from the bottom to the top. The repolarization takes place from the outside to the inside and has the opposite polarity of the
depolarization. The repolarization effects show up in the ECG electrode as a pulse
called T wave.
The repolarization wave of the atrium will not be recorded under normal recording conditions. It is extremely weak and it will fall in the middle of the depolarization account that represents the ventricular contraction excitation, the QRS complex.
During repolarization, the atrium relaxes and fills back up. The repolarization can
be distinguished from the depolarization in the cardiac action potential from the
P
0.5 mV
100 ms
FIGURE 9.6 Timing of all important waves of ECG, in particular P wave, are shown that
further identifies when and why these waves are formed.