

176
Biomedical Signal and Image Processing
If all cells are successfully excited at the apex of the heart, the migration
of electric excitation wave front through the intercalated disks will provide a
smooth depolarization. This depolarization front moves homogeneously upward
toward the base of the heart, and as a result, the blood is effectively forced out
off the ventricle with maximum efficiency. This description of the heart activity assumes a healthy normal working heart. Detectable deviations in the depolarization wave front will elicit any abnormalities in the ejection sequence and
are therefore an integral part of diagnosing the proper functioning of the pump
action of the heart.
Now that we have familiarized ourselves with the structure as well as the mechanical and electric activities of the heart, we are ready to describe ECG.
9.3
ELECTROCARDIOGRAM: SIGNAL
OF CARDIOVASCULAR SYSTEM
The depolarization and repolarization process during each heart cycle generates
local electric potential differences, which can be measured on the skin using electronic recording equipment. This group of signals, called ECG, constitutes the
most informative clinical signal commonly used in the diagnosis of the cardiovascular system.
9.3.1 ORIGIN OF ECG
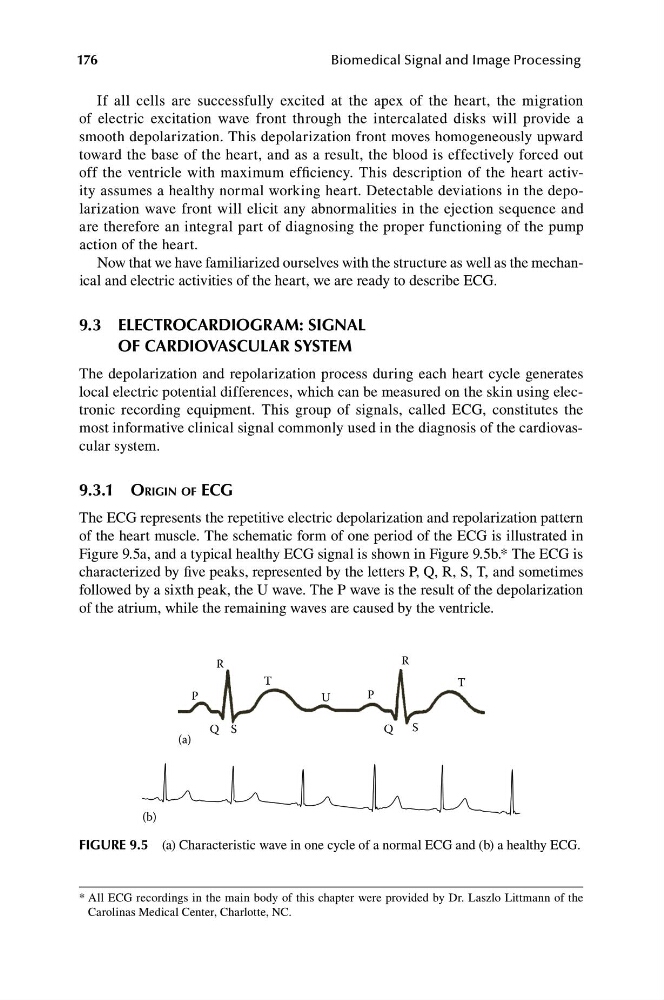
The ECG represents the repetitive electric depolarization and repolarization pattern
of the heart muscle. The schematic form of one period of the ECG is illustrated in
Figure 9.5a, and a typical healthy ECG signal is shown in Figure 9.5b.* The ECG is
characterized by five peaks, represented by the letters P, Q, R, S, T, and sometimes
followed by a sixth peak, the U wave. The P wave is the result of the depolarization
of the atrium, while the remaining waves are caused by the ventricle.
(a)
R
R
P
Q S
S
T
T
P
Q
U
(b)
FIGURE 9.5 (a) Characteristic wave in one cycle of a normal ECG and (b) a healthy ECG.
* All ECG recordings in the main body of this chapter were provided by Dr. Laszlo Littmann of the
Carolinas Medical Center, Charlotte, NC.
Biomedical Signal and Image Processing
If all cells are successfully excited at the apex of the heart, the migration
of electric excitation wave front through the intercalated disks will provide a
smooth depolarization. This depolarization front moves homogeneously upward
toward the base of the heart, and as a result, the blood is effectively forced out
off the ventricle with maximum efficiency. This description of the heart activity assumes a healthy normal working heart. Detectable deviations in the depolarization wave front will elicit any abnormalities in the ejection sequence and
are therefore an integral part of diagnosing the proper functioning of the pump
action of the heart.
Now that we have familiarized ourselves with the structure as well as the mechanical and electric activities of the heart, we are ready to describe ECG.
9.3
ELECTROCARDIOGRAM: SIGNAL
OF CARDIOVASCULAR SYSTEM
The depolarization and repolarization process during each heart cycle generates
local electric potential differences, which can be measured on the skin using electronic recording equipment. This group of signals, called ECG, constitutes the
most informative clinical signal commonly used in the diagnosis of the cardiovascular system.
9.3.1 ORIGIN OF ECG
The ECG represents the repetitive electric depolarization and repolarization pattern
of the heart muscle. The schematic form of one period of the ECG is illustrated in
Figure 9.5a, and a typical healthy ECG signal is shown in Figure 9.5b.* The ECG is
characterized by five peaks, represented by the letters P, Q, R, S, T, and sometimes
followed by a sixth peak, the U wave. The P wave is the result of the depolarization
of the atrium, while the remaining waves are caused by the ventricle.
(a)
R
R
P
Q S
S
T
T
P
Q
U
(b)
FIGURE 9.5 (a) Characteristic wave in one cycle of a normal ECG and (b) a healthy ECG.
* All ECG recordings in the main body of this chapter were provided by Dr. Laszlo Littmann of the
Carolinas Medical Center, Charlotte, NC.