

–
–
–
–
–
–
–
Passive outflow
K + -flow
Na
+ -flow
Passive outflow
Passive inflow
=
+
Exchange
diffusion
flow
Na + –K
+
pump
5.0
Membrane
5.4
3.6
1.6
1.8
1.8
1.8
Intracellular
Extracellular
1.8
Passive inflow
+
Active inflow
Metabolic
energy
A
A
A
A
A
A
A
=
K
+
K
+
K
+
K
+
K
+
ε S – ε K
ε S – ε Na
ε S
ε S – ε K
0 mV
0 mV
–155 mV
11 mV
–90 mV
–90 mV
50 mV
K
+
K
+
K
+
Cl
–
Cl
–
Cl
–
Cl
–
Cl
–
Cl
–
Cl
–
Na
+
Na
+
Na
+
Na
+
Na
+
Na
+
Na
+
ε Na
157
Electric Activities of the Cell
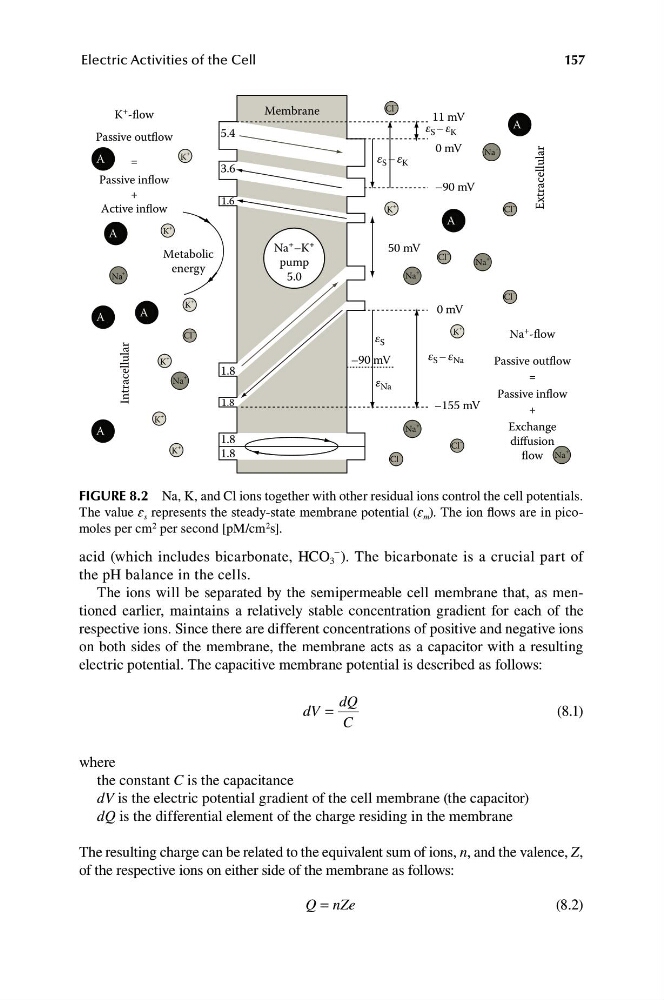
FIGURE 8.2 Na, K, and Cl ions together with other residual ions control the cell potentials.
The value ɛ s represents the steady-state membrane potential (ɛ m ). The ion flows are in picomoles per cm 2 per second [pM/cm 2 s].
acid (which includes bicarbonate, HCO 3
− ). The bicarbonate is a crucial part of
the pH balance in the cells.
The ions will be separated by the semipermeable cell membrane that, as mentioned earlier, maintains a relatively stable concentration gradient for each of the
respective ions. Since there are different concentrations of positive and negative ions
on both sides of the membrane, the membrane acts as a capacitor with a resulting
electric potential. The capacitive membrane potential is described as follows:
dQ
dV =
(8.1)
C
where
the constant C is the capacitance
dV is the electric potential gradient of the cell membrane (the capacitor)
dQ is the differential element of the charge residing in the membrane
The resulting charge can be related to the equivalent sum of ions, n, and the valence, Z,
of the respective ions on either side of the membrane as follows:
Q nZe
(8.2)
=
–
–
–
–
–
–
Passive outflow
K + -flow
Na
+ -flow
Passive outflow
Passive inflow
=
+
Exchange
diffusion
flow
Na + –K
+
pump
5.0
Membrane
5.4
3.6
1.6
1.8
1.8
1.8
Intracellular
Extracellular
1.8
Passive inflow
+
Active inflow
Metabolic
energy
A
A
A
A
A
A
A
=
K
+
K
+
K
+
K
+
K
+
ε S – ε K
ε S – ε Na
ε S
ε S – ε K
0 mV
0 mV
–155 mV
11 mV
–90 mV
–90 mV
50 mV
K
+
K
+
K
+
Cl
–
Cl
–
Cl
–
Cl
–
Cl
–
Cl
–
Cl
–
Na
+
Na
+
Na
+
Na
+
Na
+
Na
+
Na
+
ε Na
157
Electric Activities of the Cell
FIGURE 8.2 Na, K, and Cl ions together with other residual ions control the cell potentials.
The value ɛ s represents the steady-state membrane potential (ɛ m ). The ion flows are in picomoles per cm 2 per second [pM/cm 2 s].
acid (which includes bicarbonate, HCO 3
− ). The bicarbonate is a crucial part of
the pH balance in the cells.
The ions will be separated by the semipermeable cell membrane that, as mentioned earlier, maintains a relatively stable concentration gradient for each of the
respective ions. Since there are different concentrations of positive and negative ions
on both sides of the membrane, the membrane acts as a capacitor with a resulting
electric potential. The capacitive membrane potential is described as follows:
dQ
dV =
(8.1)
C
where
the constant C is the capacitance
dV is the electric potential gradient of the cell membrane (the capacitor)
dQ is the differential element of the charge residing in the membrane
The resulting charge can be related to the equivalent sum of ions, n, and the valence, Z,
of the respective ions on either side of the membrane as follows:
Q nZe
(8.2)
=