

h(n) filter
each row
h(n) filter
each column
h(n) filter
each column
2 along
g(n) filter
2 along
each column
g(n) filter
each column
each column
g(n) filter
each column
each row
each row
2 along
each column
2 along
each column
2 along
2 along
each row
f 0 (x, y)
f v (x, y)
f(x, y)
f h (x, y)
f d (x, y)
95
Wavelet Transform
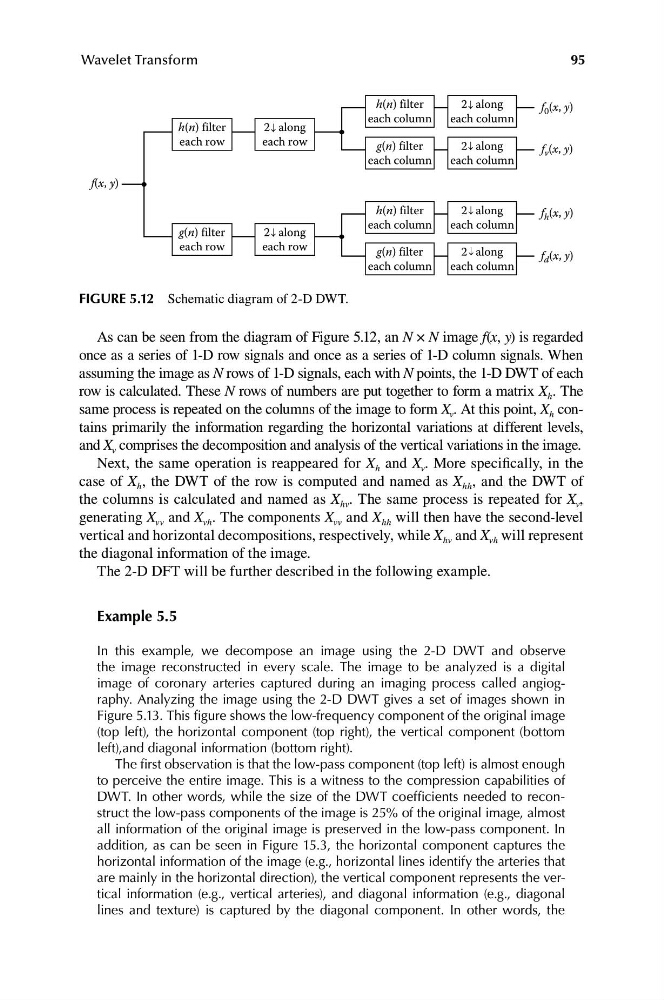
FIGURE 5.12 Schematic diagram of 2-D DWT.
As can be seen from the diagram of Figure 5.12, an N × N image f(x, y) is regarded
once as a series of 1-D row signals and once as a series of 1-D column signals. When
assuming the image as N rows of 1-D signals, each with N points, the 1-D DWT of each
row is calculated. These N rows of numbers are put together to form a matrix X h . The
same process is repeated on the columns of the image to form X v . At this point, X h contains primarily the information regarding the horizontal variations at different levels,
and X v comprises the decomposition and analysis of the vertical variations in the image.
Next, the same operation is reappeared for X h and X v . More specifically, in the
case of X h , the DWT of the row is computed and named as X hh , and the DWT of
the columns is calculated and named as X hv . The same process is repeated for X v ,
generating X vv and X vh . The components X vv and X hh will then have the second-level
vertical and horizontal decompositions, respectively, while X hv and X vh will represent
the diagonal information of the image.
The 2-D DFT will be further described in the following example.
Example 5.5
In this example, we decompose an image using the 2-D DWT and observe
the image reconstructed in every scale. The image to be analyzed is a digital
image of coronary arteries captured during an imaging process called angiography. Analyzing the image using the 2-D DWT gives a set of images shown in
Figure 5.13. This figure shows the low-frequency component of the original image
(top left), the horizontal component (top right), the vertical component (bottom
left),and diagonal information (bottom right).
The first observation is that the low-pass component (top left) is almost enough
to perceive the entire image. This is a witness to the compression capabilities of
DWT. In other words, while the size of the DWT coefficients needed to reconstruct the low-pass components of the image is 25% of the original image, almost
all information of the original image is preserved in the low-pass component. In
addition, as can be seen in Figure 15.3, the horizontal component captures the
horizontal information of the image (e.g., horizontal lines identify the arteries that
are mainly in the horizontal direction), the vertical component represents the vertical information (e.g., vertical arteries), and diagonal information (e.g., diagonal
lines and texture) is captured by the diagonal component. In other words, the
each row
h(n) filter
each column
h(n) filter
each column
2 along
g(n) filter
2 along
each column
g(n) filter
each column
each column
g(n) filter
each column
each row
each row
2 along
each column
2 along
each column
2 along
2 along
each row
f 0 (x, y)
f v (x, y)
f(x, y)
f h (x, y)
f d (x, y)
95
Wavelet Transform
FIGURE 5.12 Schematic diagram of 2-D DWT.
As can be seen from the diagram of Figure 5.12, an N × N image f(x, y) is regarded
once as a series of 1-D row signals and once as a series of 1-D column signals. When
assuming the image as N rows of 1-D signals, each with N points, the 1-D DWT of each
row is calculated. These N rows of numbers are put together to form a matrix X h . The
same process is repeated on the columns of the image to form X v . At this point, X h contains primarily the information regarding the horizontal variations at different levels,
and X v comprises the decomposition and analysis of the vertical variations in the image.
Next, the same operation is reappeared for X h and X v . More specifically, in the
case of X h , the DWT of the row is computed and named as X hh , and the DWT of
the columns is calculated and named as X hv . The same process is repeated for X v ,
generating X vv and X vh . The components X vv and X hh will then have the second-level
vertical and horizontal decompositions, respectively, while X hv and X vh will represent
the diagonal information of the image.
The 2-D DFT will be further described in the following example.
Example 5.5
In this example, we decompose an image using the 2-D DWT and observe
the image reconstructed in every scale. The image to be analyzed is a digital
image of coronary arteries captured during an imaging process called angiography. Analyzing the image using the 2-D DWT gives a set of images shown in
Figure 5.13. This figure shows the low-frequency component of the original image
(top left), the horizontal component (top right), the vertical component (bottom
left),and diagonal information (bottom right).
The first observation is that the low-pass component (top left) is almost enough
to perceive the entire image. This is a witness to the compression capabilities of
DWT. In other words, while the size of the DWT coefficients needed to reconstruct the low-pass components of the image is 25% of the original image, almost
all information of the original image is preserved in the low-pass component. In
addition, as can be seen in Figure 15.3, the horizontal component captures the
horizontal information of the image (e.g., horizontal lines identify the arteries that
are mainly in the horizontal direction), the vertical component represents the vertical information (e.g., vertical arteries), and diagonal information (e.g., diagonal
lines and texture) is captured by the diagonal component. In other words, the