

120
6 Risk Assessment and Management of Chemical Products
Once the internal steady-state concentration of the chemical in the lipids is
reached, we assume that the oral exposure ends (D oral = 0). Then, the body’s
elimination of the chemical will result in an eventual total removal of the chemical
from the lipids. To describe this, Eq. 6.4 can be rewritten as:
dc lip (t)
dt
= −k elim × c lip (t)
(6.8)
where c lip (t = 0) = c stst
lip . This then results in:
c lip (t) = c
stst
lip × e
−k elim ×t
(6.9)
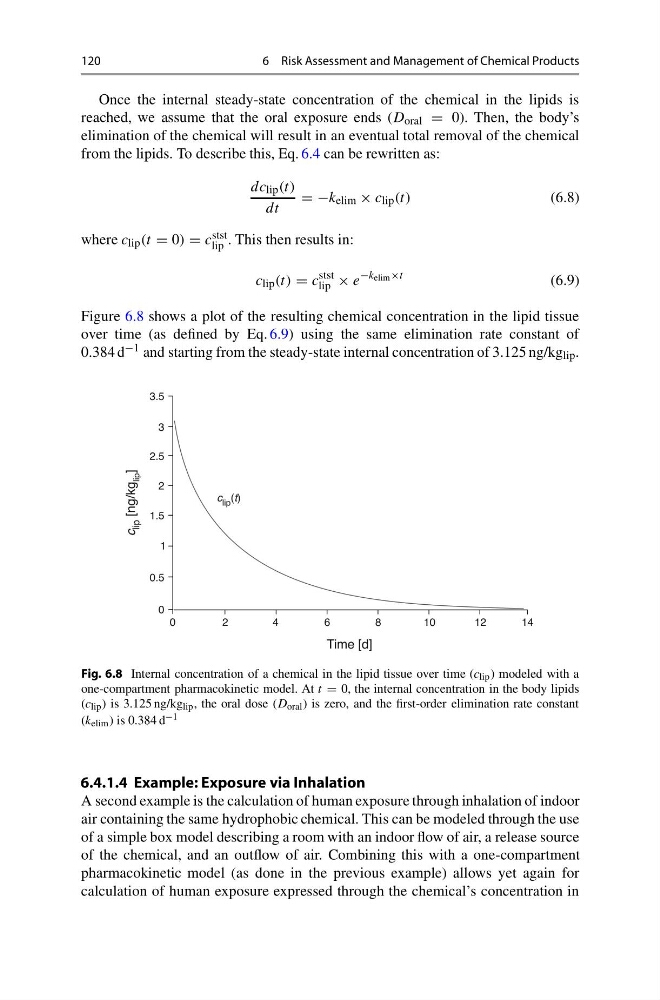
Figure 6.8 shows a plot of the resulting chemical concentration in the lipid tissue
over time (as defined by Eq. 6.9) using the same elimination rate constant of
0.384 d −1 and starting from the steady-state internal concentration of 3.125 ng/kg lip .
Fig. 6.8 Internal concentration of a chemical in the lipid tissue over time (c lip ) modeled with a
one-compartment pharmacokinetic model. At t = 0, the internal concentration in the body lipids
(c lip ) is 3.125 ng/kg lip , the oral dose (D oral ) is zero, and the first-order elimination rate constant
(k elim ) is 0.384 d −1
6.4.1.4 Example: Exposure via Inhalation
A second example is the calculation of human exposure through inhalation of indoor
air containing the same hydrophobic chemical. This can be modeled through the use
of a simple box model describing a room with an indoor flow of air, a release source
of the chemical, and an outflow of air. Combining this with a one-compartment
pharmacokinetic model (as done in the previous example) allows yet again for
calculation of human exposure expressed through the chemical’s concentration in
6 Risk Assessment and Management of Chemical Products
Once the internal steady-state concentration of the chemical in the lipids is
reached, we assume that the oral exposure ends (D oral = 0). Then, the body’s
elimination of the chemical will result in an eventual total removal of the chemical
from the lipids. To describe this, Eq. 6.4 can be rewritten as:
dc lip (t)
dt
= −k elim × c lip (t)
(6.8)
where c lip (t = 0) = c stst
lip . This then results in:
c lip (t) = c
stst
lip × e
−k elim ×t
(6.9)
Figure 6.8 shows a plot of the resulting chemical concentration in the lipid tissue
over time (as defined by Eq. 6.9) using the same elimination rate constant of
0.384 d −1 and starting from the steady-state internal concentration of 3.125 ng/kg lip .
Fig. 6.8 Internal concentration of a chemical in the lipid tissue over time (c lip ) modeled with a
one-compartment pharmacokinetic model. At t = 0, the internal concentration in the body lipids
(c lip ) is 3.125 ng/kg lip , the oral dose (D oral ) is zero, and the first-order elimination rate constant
(k elim ) is 0.384 d −1
6.4.1.4 Example: Exposure via Inhalation
A second example is the calculation of human exposure through inhalation of indoor
air containing the same hydrophobic chemical. This can be modeled through the use
of a simple box model describing a room with an indoor flow of air, a release source
of the chemical, and an outflow of air. Combining this with a one-compartment
pharmacokinetic model (as done in the previous example) allows yet again for
calculation of human exposure expressed through the chemical’s concentration in