

6.4 Exposure Assessment (Step 2)
119
c lip (t) =
1 − e −k elim ×t
k elim
× D oral
(6.6)
Eventually, the concentration in the lipids reaches a steady state (“stst”):
c
stst
lip =
D oral
k elim
(6.7)
• c lip (t): time-dependent internal concentration of chemical in human lipid tissue
[ng/kg lip ]
• c stst
lip : internal steady-state concentration of chemical in human lipid tissue
[ng/kg lip ]
• k elim : first-order elimination rate constant [d −1 ] derived from the intrinsic
elimination half-life, t 1/2 , as k elim = ln 2/t 1/2
• m lip : total mass of lipid tissue in human (adult average value: ca. 10 kg)
• D oral : oral dose [ng kg
−1
lip d −1 ]
• Assumptions: c lip (t = 0) = 0, m lip = constant, D oral = constant
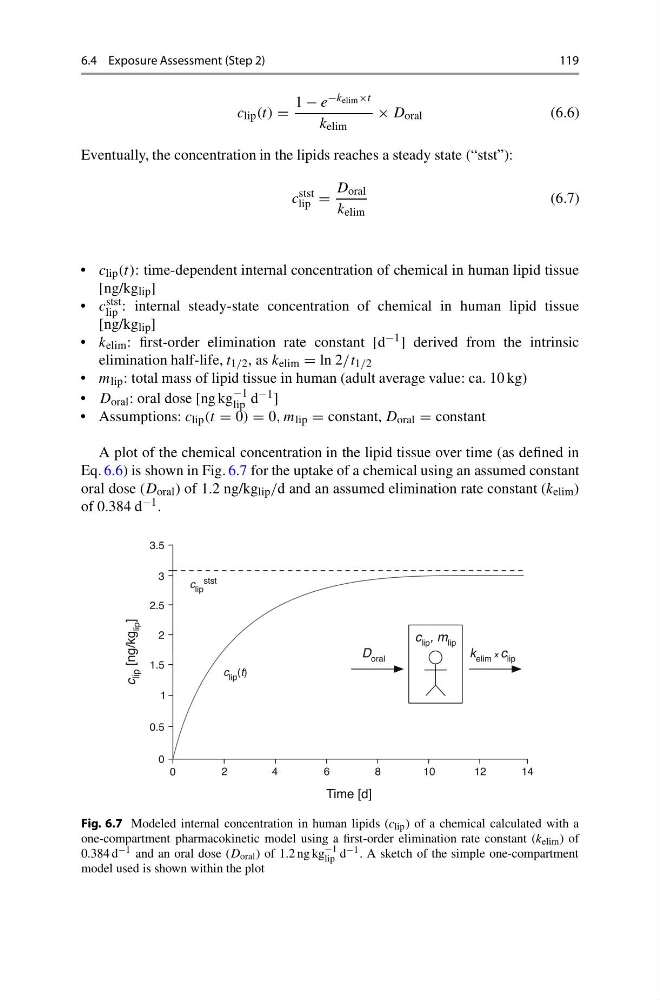
A plot of the chemical concentration in the lipid tissue over time (as defined in
Eq. 6.6) is shown in Fig. 6.7 for the uptake of a chemical using an assumed constant
oral dose (D oral ) of 1.2 ng/kg lip /d and an assumed elimination rate constant (k elim )
of 0.384 d −1 .
Fig. 6.7 Modeled internal concentration in human lipids (c lip ) of a chemical calculated with a
one-compartment pharmacokinetic model using a first-order elimination rate constant (k elim ) of
0.384 d −1 and an oral dose (D oral ) of 1.2 ng kg
−1
lip d −1 . A sketch of the simple one-compartment
model used is shown within the plot
119
c lip (t) =
1 − e −k elim ×t
k elim
× D oral
(6.6)
Eventually, the concentration in the lipids reaches a steady state (“stst”):
c
stst
lip =
D oral
k elim
(6.7)
• c lip (t): time-dependent internal concentration of chemical in human lipid tissue
[ng/kg lip ]
• c stst
lip : internal steady-state concentration of chemical in human lipid tissue
[ng/kg lip ]
• k elim : first-order elimination rate constant [d −1 ] derived from the intrinsic
elimination half-life, t 1/2 , as k elim = ln 2/t 1/2
• m lip : total mass of lipid tissue in human (adult average value: ca. 10 kg)
• D oral : oral dose [ng kg
−1
lip d −1 ]
• Assumptions: c lip (t = 0) = 0, m lip = constant, D oral = constant
A plot of the chemical concentration in the lipid tissue over time (as defined in
Eq. 6.6) is shown in Fig. 6.7 for the uptake of a chemical using an assumed constant
oral dose (D oral ) of 1.2 ng/kg lip /d and an assumed elimination rate constant (k elim )
of 0.384 d −1 .
Fig. 6.7 Modeled internal concentration in human lipids (c lip ) of a chemical calculated with a
one-compartment pharmacokinetic model using a first-order elimination rate constant (k elim ) of
0.384 d −1 and an oral dose (D oral ) of 1.2 ng kg
−1
lip d −1 . A sketch of the simple one-compartment
model used is shown within the plot