

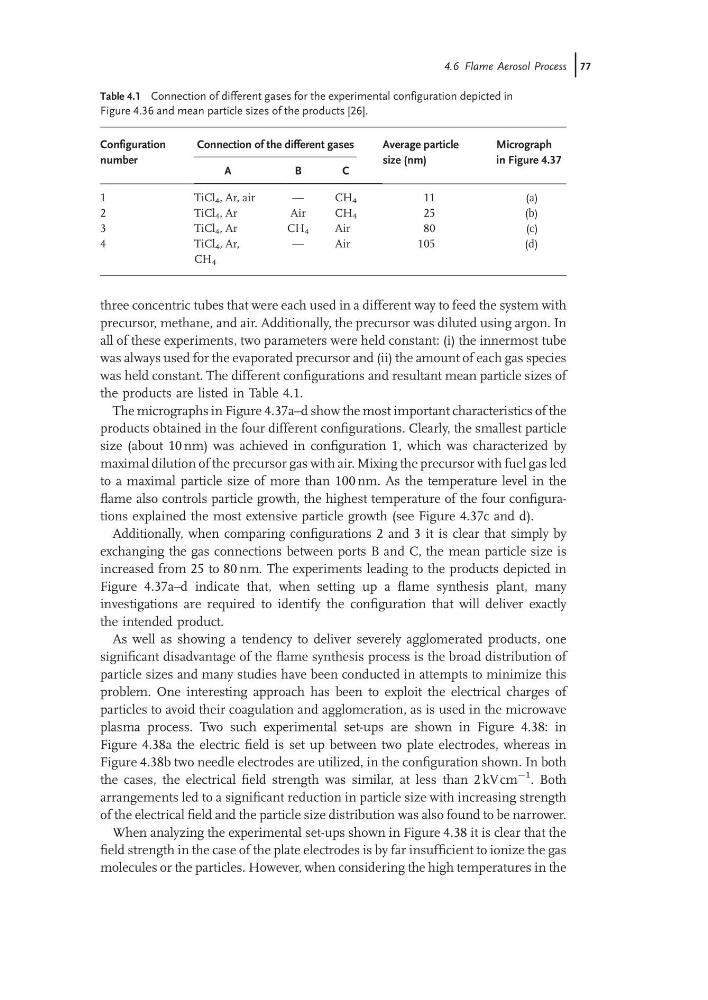
three concentric tubes that were each used in a different way to feed the system with
precursor, methane, and air. Additionally, the precursor was diluted using argon. In
all of these experiments, two parameters were held constant: (i) the innermost tube
was always used for the evaporated precursor and (ii) the amount of each gas species
was held constant. The different configurations and resultant mean particle sizes of
the products are listed in Table 4.1.
The micrographs in Figure 4.37a–d show the most important characteristics of the
products obtained in the four different configurations. Clearly, the smallest particle
size (about 10 nm) was achieved in configuration 1, which was characterized by
maximal dilution of the precursor gas with air. Mixing the precursor with fuel gas led
to a maximal particle size of more than 100 nm. As the temperature level in the
flame also controls particle growth, the highest temperature of the four configurations explained the most extensive particle growth (see Figure 4.37c and d).
Additionally, when comparing configurations 2 and 3 it is clear that simply by
exchanging the gas connections between ports B and C, the mean particle size is
increased from 25 to 80 nm. The experiments leading to the products depicted in
Figure 4.37a–d indicate that, when setting up a flame synthesis plant, many
investigations are required to identify the configuration that will deliver exactly
the intended product.
As well as showing a tendency to deliver severely agglomerated products, one
significant disadvantage of the flame synthesis process is the broad distribution of
particle sizes and many studies have been conducted in attempts to minimize this
problem. One interesting approach has been to exploit the electrical charges of
particles to avoid their coagulation and agglomeration, as is used in the microwave
plasma process. Two such experimental set-ups are shown in Figure 4.38: in
Figure 4.38a the electric field is set up between two plate electrodes, whereas in
Figure 4.38b two needle electrodes are utilized, in the configuration shown. In both
the cases, the electrical field strength was similar, at less than 2 kV cm
À1 . Both
arrangements led to a significant reduction in particle size with increasing strength
of the electrical field and the particle size distribution was also found to be narrower.
When analyzing the experimental set-ups shown in Figure 4.38 it is clear that the
field strength in the case of the plate electrodes is by far insufficient to ionize the gas
molecules or the particles. However, when considering the high temperatures in the
Table 4.1 Connection of different gases for the experimental configuration depicted in
Figure 4.36 and mean particle sizes of the products [26].
Configuration
number
Connection of the different gases
Average particle
size (nm)
Micrograph
in Figure 4.37
A
B
C
1
TiCl 4 , Ar, air
—
CH 4
11
(a)
2
TiCl 4 , Ar
Air
CH 4
25
(b)
3
TiCl 4 , Ar
CH 4
Air
80
(c)
4
TiCl 4 , Ar,
CH 4
—
Air
105
(d)
4.6 Flame Aerosol Process j77
precursor, methane, and air. Additionally, the precursor was diluted using argon. In
all of these experiments, two parameters were held constant: (i) the innermost tube
was always used for the evaporated precursor and (ii) the amount of each gas species
was held constant. The different configurations and resultant mean particle sizes of
the products are listed in Table 4.1.
The micrographs in Figure 4.37a–d show the most important characteristics of the
products obtained in the four different configurations. Clearly, the smallest particle
size (about 10 nm) was achieved in configuration 1, which was characterized by
maximal dilution of the precursor gas with air. Mixing the precursor with fuel gas led
to a maximal particle size of more than 100 nm. As the temperature level in the
flame also controls particle growth, the highest temperature of the four configurations explained the most extensive particle growth (see Figure 4.37c and d).
Additionally, when comparing configurations 2 and 3 it is clear that simply by
exchanging the gas connections between ports B and C, the mean particle size is
increased from 25 to 80 nm. The experiments leading to the products depicted in
Figure 4.37a–d indicate that, when setting up a flame synthesis plant, many
investigations are required to identify the configuration that will deliver exactly
the intended product.
As well as showing a tendency to deliver severely agglomerated products, one
significant disadvantage of the flame synthesis process is the broad distribution of
particle sizes and many studies have been conducted in attempts to minimize this
problem. One interesting approach has been to exploit the electrical charges of
particles to avoid their coagulation and agglomeration, as is used in the microwave
plasma process. Two such experimental set-ups are shown in Figure 4.38: in
Figure 4.38a the electric field is set up between two plate electrodes, whereas in
Figure 4.38b two needle electrodes are utilized, in the configuration shown. In both
the cases, the electrical field strength was similar, at less than 2 kV cm
À1 . Both
arrangements led to a significant reduction in particle size with increasing strength
of the electrical field and the particle size distribution was also found to be narrower.
When analyzing the experimental set-ups shown in Figure 4.38 it is clear that the
field strength in the case of the plate electrodes is by far insufficient to ionize the gas
molecules or the particles. However, when considering the high temperatures in the
Table 4.1 Connection of different gases for the experimental configuration depicted in
Figure 4.36 and mean particle sizes of the products [26].
Configuration
number
Connection of the different gases
Average particle
size (nm)
Micrograph
in Figure 4.37
A
B
C
1
TiCl 4 , Ar, air
—
CH 4
11
(a)
2
TiCl 4 , Ar
Air
CH 4
25
(b)
3
TiCl 4 , Ar
CH 4
Air
80
(c)
4
TiCl 4 , Ar,
CH 4
—
Air
105
(d)
4.6 Flame Aerosol Process j77