

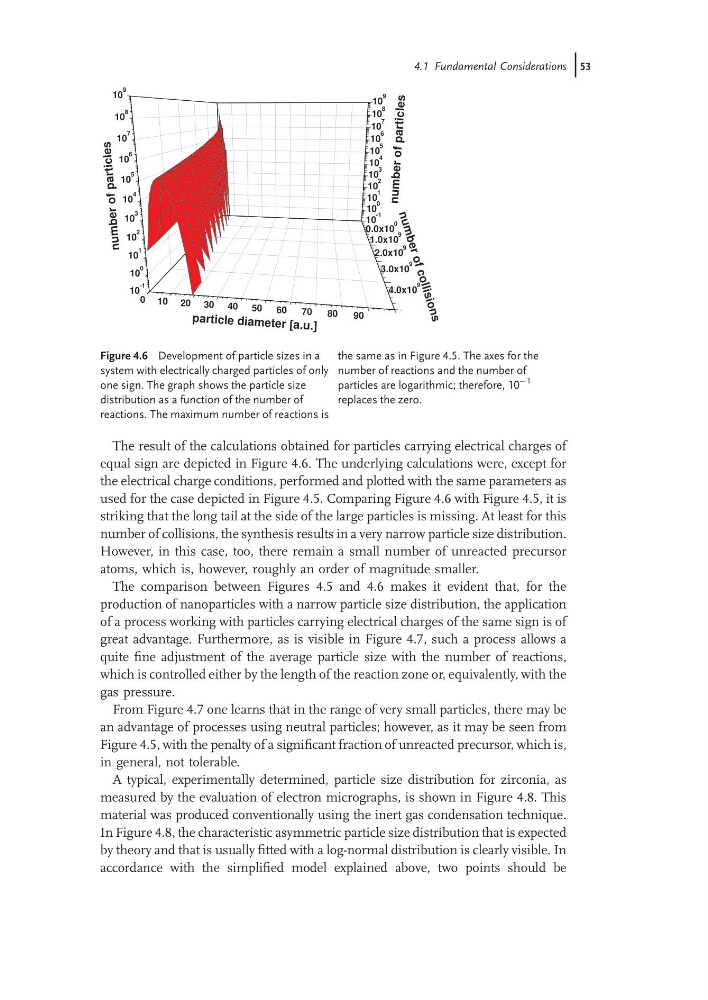
The result of the calculations obtained for particles carrying electrical charges of
equal sign are depicted in Figure 4.6. The underlying calculations were, except for
the electrical charge conditions, performed and plotted with the same parameters as
used for the case depicted in Figure 4.5. Comparing Figure 4.6 with Figure 4.5, it is
striking that the long tail at the side of the large particles is missing. At least for this
number of collisions, the synthesis results in a very narrow particle size distribution.
However, in this case, too, there remain a small number of unreacted precursor
atoms, which is, however, roughly an order of magnitude smaller.
The comparison between Figures 4.5 and 4.6 makes it evident that, for the
production of nanoparticles with a narrow particle size distribution, the application
of a process working with particles carrying electrical charges of the same sign is of
great advantage. Furthermore, as is visible in Figure 4.7, such a process allows a
quite fine adjustment of the average particle size with the number of reactions,
which is controlled either by the length of the reaction zone or, equivalently, with the
gas pressure.
From Figure 4.7 one learns that in the range of very small particles, there may be
an advantage of processes using neutral particles; however, as it may be seen from
Figure 4.5, with the penalty of a significant fraction of unreacted precursor, which is,
in general, not tolerable.
A typical, experimentally determined, particle size distribution for zirconia, as
measured by the evaluation of electron micrographs, is shown in Figure 4.8. This
material was produced conventionally using the inert gas condensation technique.
In Figure 4.8, the characteristic asymmetric particle size distribution that is expected
by theory and that is usually fitted with a log-normal distribution is clearly visible. In
accordance with the simplified model explained above, two points should be
0.0x10
0
1.0x10
9
2.0x10
9
3.0x10
9
4.0x10
9
0 10 20 30 40 50
60
70
80
90
10
-1
10
0
10
1
10
2
10
3
10
4
10
5
10
6
10
7
10
8
10
9
10
-1
10
0
10
1
10
2
10
3
10
4
10
5
10
6
10
7
10
8
10
9
num
ber
of
par
ticle
s
parti cle diam eter [a.u. ]
n u m b e r o f c o ll is io n s
num ber of parti cles
Figure 4.6 Development of particle sizes in a
system with electrically charged particles of only
one sign. The graph shows the particle size
distribution as a function of the number of
reactions. The maximum number of reactions is
the same as in Figure 4.5. The axes for the
number of reactions and the number of
particles are logarithmic; therefore, 10
À1
replaces the zero.
4.1 Fundamental Considerations j53
equal sign are depicted in Figure 4.6. The underlying calculations were, except for
the electrical charge conditions, performed and plotted with the same parameters as
used for the case depicted in Figure 4.5. Comparing Figure 4.6 with Figure 4.5, it is
striking that the long tail at the side of the large particles is missing. At least for this
number of collisions, the synthesis results in a very narrow particle size distribution.
However, in this case, too, there remain a small number of unreacted precursor
atoms, which is, however, roughly an order of magnitude smaller.
The comparison between Figures 4.5 and 4.6 makes it evident that, for the
production of nanoparticles with a narrow particle size distribution, the application
of a process working with particles carrying electrical charges of the same sign is of
great advantage. Furthermore, as is visible in Figure 4.7, such a process allows a
quite fine adjustment of the average particle size with the number of reactions,
which is controlled either by the length of the reaction zone or, equivalently, with the
gas pressure.
From Figure 4.7 one learns that in the range of very small particles, there may be
an advantage of processes using neutral particles; however, as it may be seen from
Figure 4.5, with the penalty of a significant fraction of unreacted precursor, which is,
in general, not tolerable.
A typical, experimentally determined, particle size distribution for zirconia, as
measured by the evaluation of electron micrographs, is shown in Figure 4.8. This
material was produced conventionally using the inert gas condensation technique.
In Figure 4.8, the characteristic asymmetric particle size distribution that is expected
by theory and that is usually fitted with a log-normal distribution is clearly visible. In
accordance with the simplified model explained above, two points should be
0.0x10
0
1.0x10
9
2.0x10
9
3.0x10
9
4.0x10
9
0 10 20 30 40 50
60
70
80
90
10
-1
10
0
10
1
10
2
10
3
10
4
10
5
10
6
10
7
10
8
10
9
10
-1
10
0
10
1
10
2
10
3
10
4
10
5
10
6
10
7
10
8
10
9
num
ber
of
par
ticle
s
parti cle diam eter [a.u. ]
n u m b e r o f c o ll is io n s
num ber of parti cles
Figure 4.6 Development of particle sizes in a
system with electrically charged particles of only
one sign. The graph shows the particle size
distribution as a function of the number of
reactions. The maximum number of reactions is
the same as in Figure 4.5. The axes for the
number of reactions and the number of
particles are logarithmic; therefore, 10
À1
replaces the zero.
4.1 Fundamental Considerations j53