

On the right-hand side of Eq. (4.10), the weighting term f ij describes the
probability for the process, as they are given in Eqs. (4.5) and (4.9). As the number
of atoms in the system is always constant, at each step (time) t, the side condition:
N tot ¼
X nmax
n¼1
nN t; n
ð Þ
ð4:11Þ
is valid.
As in Eq. (4.10) each reaction step is random and independent of the preceding
one; this model leads to a Poisson distribution of the particle sizes, which is because
of a better handling approximated by a log-normal distribution. Equation (4.10)
delivers particle numbers as function of time and volume. The diameter d of the
particles, is given by d ¼ i þ j
ð
Þ
1=3
l
m
.
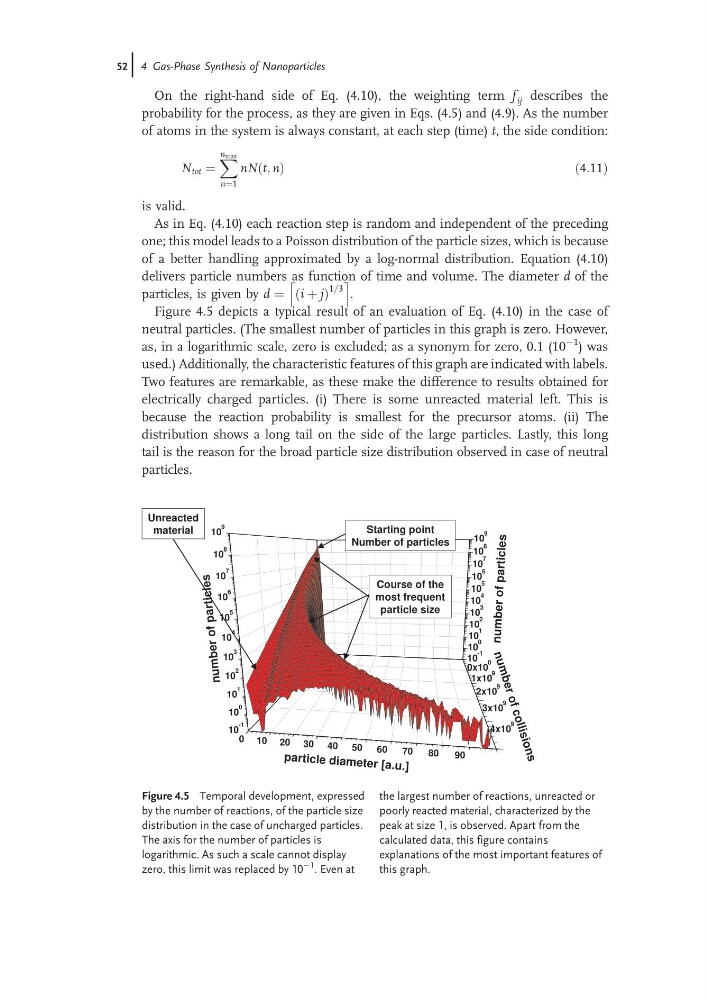
Figure 4.5 depicts a typical result of an evaluation of Eq. (4.10) in the case of
neutral particles. (The smallest number of particles in this graph is zero. However,
as, in a logarithmic scale, zero is excluded; as a synonym for zero, 0.1 (10
À1 ) was
used.) Additionally, the characteristic features of this graph are indicated with labels.
Two features are remarkable, as these make the difference to results obtained for
electrically charged particles. (i) There is some unreacted material left. This is
because the reaction probability is smallest for the precursor atoms. (ii) The
distribution shows a long tail on the side of the large particles. Lastly, this long
tail is the reason for the broad particle size distribution observed in case of neutral
particles.
0x10
0
1x10
9
2x10
9
3x10
9
4x10
9
0 10 20 30 40 50
60
70
80
90
10
-1
10
0
10
1
10
2
10
3
10
4
10
5
10
6
10
7
10
8
10
9
10
-1
10
0
10
1
10
2
10
3
10
4
10
5
10
6
10
7
10
8
10
9
num
ber
of
par
ticl
es
numb er of partic les
part icle diam eter [a.u .]
Starting point
Number of particles
Unreacted
material
Course of the
most frequent
particle size
n
u
m
b
e
r
o
f
c
o
ll
is
io
n
s
Figure 4.5 Temporal development, expressed
by the number of reactions, of the particle size
distribution in the case of uncharged particles.
The axis for the number of particles is
logarithmic. As such a scale cannot display
zero, this limit was replaced by 10
À1 . Even at
the largest number of reactions, unreacted or
poorly reacted material, characterized by the
peak at size 1, is observed. Apart from the
calculated data, this figure contains
explanations of the most important features of
this graph.
52j 4 Gas-Phase Synthesis of Nanoparticles
probability for the process, as they are given in Eqs. (4.5) and (4.9). As the number
of atoms in the system is always constant, at each step (time) t, the side condition:
N tot ¼
X nmax
n¼1
nN t; n
ð Þ
ð4:11Þ
is valid.
As in Eq. (4.10) each reaction step is random and independent of the preceding
one; this model leads to a Poisson distribution of the particle sizes, which is because
of a better handling approximated by a log-normal distribution. Equation (4.10)
delivers particle numbers as function of time and volume. The diameter d of the
particles, is given by d ¼ i þ j
ð
Þ
1=3
l
m
.
Figure 4.5 depicts a typical result of an evaluation of Eq. (4.10) in the case of
neutral particles. (The smallest number of particles in this graph is zero. However,
as, in a logarithmic scale, zero is excluded; as a synonym for zero, 0.1 (10
À1 ) was
used.) Additionally, the characteristic features of this graph are indicated with labels.
Two features are remarkable, as these make the difference to results obtained for
electrically charged particles. (i) There is some unreacted material left. This is
because the reaction probability is smallest for the precursor atoms. (ii) The
distribution shows a long tail on the side of the large particles. Lastly, this long
tail is the reason for the broad particle size distribution observed in case of neutral
particles.
0x10
0
1x10
9
2x10
9
3x10
9
4x10
9
0 10 20 30 40 50
60
70
80
90
10
-1
10
0
10
1
10
2
10
3
10
4
10
5
10
6
10
7
10
8
10
9
10
-1
10
0
10
1
10
2
10
3
10
4
10
5
10
6
10
7
10
8
10
9
num
ber
of
par
ticl
es
numb er of partic les
part icle diam eter [a.u .]
Starting point
Number of particles
Unreacted
material
Course of the
most frequent
particle size
n
u
m
b
e
r
o
f
c
o
ll
is
io
n
s
Figure 4.5 Temporal development, expressed
by the number of reactions, of the particle size
distribution in the case of uncharged particles.
The axis for the number of particles is
logarithmic. As such a scale cannot display
zero, this limit was replaced by 10
À1 . Even at
the largest number of reactions, unreacted or
poorly reacted material, characterized by the
peak at size 1, is observed. Apart from the
calculated data, this figure contains
explanations of the most important features of
this graph.
52j 4 Gas-Phase Synthesis of Nanoparticles