

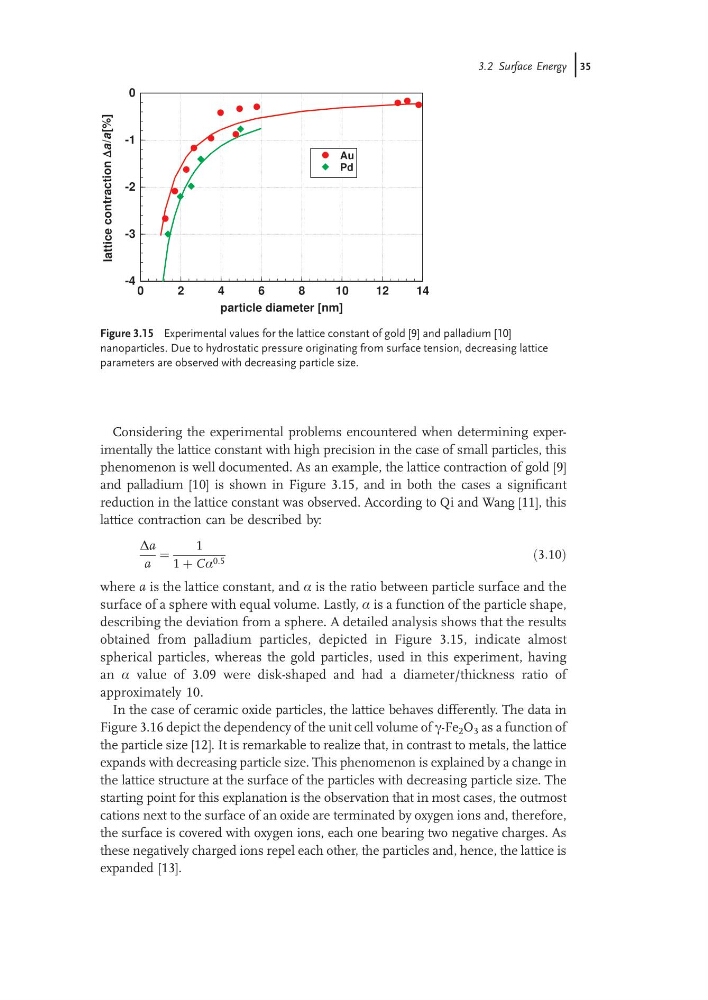
Considering the experimental problems encountered when determining experimentally the lattice constant with high precision in the case of small particles, this
phenomenon is well documented. As an example, the lattice contraction of gold [9]
and palladium [10] is shown in Figure 3.15, and in both the cases a significant
reduction in the lattice constant was observed. According to Qi and Wang [11], this
lattice contraction can be described by:
Da
a
¼
1
1 þ Ca 0:5
ð3:10Þ
where a is the lattice constant, and a is the ratio between particle surface and the
surface of a sphere with equal volume. Lastly, a is a function of the particle shape,
describing the deviation from a sphere. A detailed analysis shows that the results
obtained from palladium particles, depicted in Figure 3.15, indicate almost
spherical particles, whereas the gold particles, used in this experiment, having
an a value of 3.09 were disk-shaped and had a diameter/thickness ratio of
approximately 10.
In the case of ceramic oxide particles, the lattice behaves differently. The data in
Figure 3.16 depict the dependency of the unit cell volume of c-Fe 2 O 3 as a function of
the particle size [12]. It is remarkable to realize that, in contrast to metals, the lattice
expands with decreasing particle size. This phenomenon is explained by a change in
the lattice structure at the surface of the particles with decreasing particle size. The
starting point for this explanation is the observation that in most cases, the outmost
cations next to the surface of an oxide are terminated by oxygen ions and, therefore,
the surface is covered with oxygen ions, each one bearing two negative charges. As
these negatively charged ions repel each other, the particles and, hence, the lattice is
expanded [13].
0
2
4
6
8
10
12
14
particle diameter [nm]
-4
-3
-2
-1
0
lattice
contraction
Δa/a[%]
Au
Pd
Figure 3.15 Experimental values for the lattice constant of gold [9] and palladium [10]
nanoparticles. Due to hydrostatic pressure originating from surface tension, decreasing lattice
parameters are observed with decreasing particle size.
3.2 Surface Energy j35
phenomenon is well documented. As an example, the lattice contraction of gold [9]
and palladium [10] is shown in Figure 3.15, and in both the cases a significant
reduction in the lattice constant was observed. According to Qi and Wang [11], this
lattice contraction can be described by:
Da
a
¼
1
1 þ Ca 0:5
ð3:10Þ
where a is the lattice constant, and a is the ratio between particle surface and the
surface of a sphere with equal volume. Lastly, a is a function of the particle shape,
describing the deviation from a sphere. A detailed analysis shows that the results
obtained from palladium particles, depicted in Figure 3.15, indicate almost
spherical particles, whereas the gold particles, used in this experiment, having
an a value of 3.09 were disk-shaped and had a diameter/thickness ratio of
approximately 10.
In the case of ceramic oxide particles, the lattice behaves differently. The data in
Figure 3.16 depict the dependency of the unit cell volume of c-Fe 2 O 3 as a function of
the particle size [12]. It is remarkable to realize that, in contrast to metals, the lattice
expands with decreasing particle size. This phenomenon is explained by a change in
the lattice structure at the surface of the particles with decreasing particle size. The
starting point for this explanation is the observation that in most cases, the outmost
cations next to the surface of an oxide are terminated by oxygen ions and, therefore,
the surface is covered with oxygen ions, each one bearing two negative charges. As
these negatively charged ions repel each other, the particles and, hence, the lattice is
expanded [13].
0
2
4
6
8
10
12
14
particle diameter [nm]
-4
-3
-2
-1
0
lattice
contraction
Δa/a[%]
Au
Pd
Figure 3.15 Experimental values for the lattice constant of gold [9] and palladium [10]
nanoparticles. Due to hydrostatic pressure originating from surface tension, decreasing lattice
parameters are observed with decreasing particle size.
3.2 Surface Energy j35