

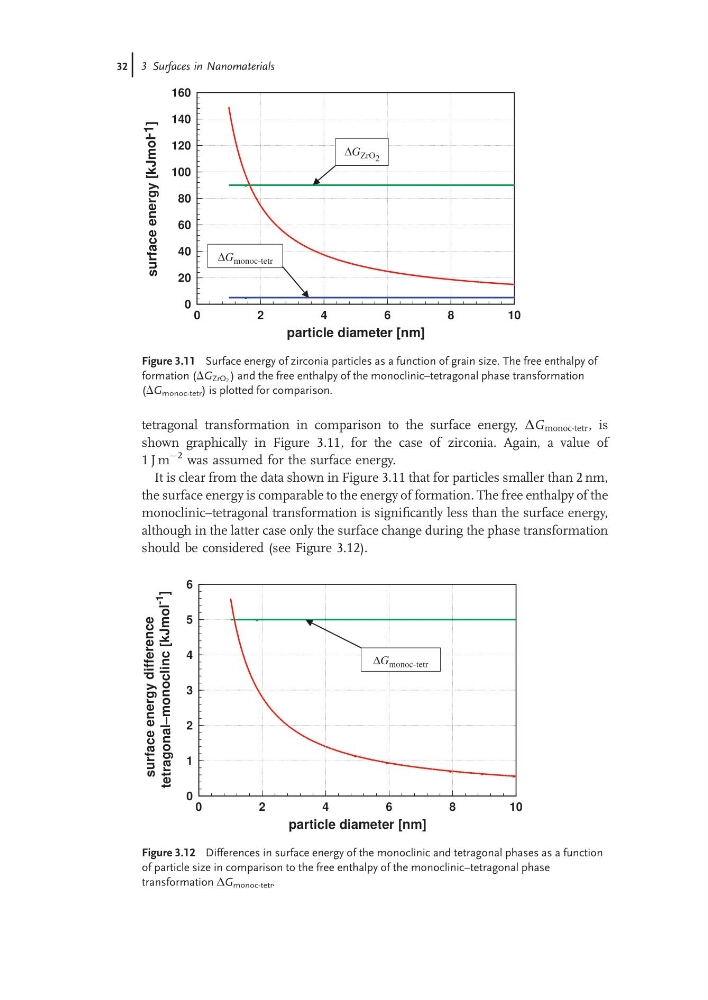
tetragonal transformation in comparison to the surface energy, DG monoc-tetr , is
shown graphically in Figure 3.11, for the case of zirconia. Again, a value of
1 J m
À2 was assumed for the surface energy.
It is clear from the data shown in Figure 3.11 that for particles smaller than 2 nm,
the surface energy is comparable to the energy of formation. The free enthalpy of the
monoclinic–tetragonal transformation is significantly less than the surface energy,
although in the latter case only the surface change during the phase transformation
should be considered (see Figure 3.12).
0
2
4
6
8
10
particle diameter [nm]
0
20
40
60
80
100
120
140
160
surface
energy
[kJmol
-1 ]
ΔG ZrO 2
ΔG monoc-tetr
Figure 3.11 Surface energy of zirconia particles as a function of grain size. The free enthalpy of
formation (DG ZrO2 ) and the free enthalpy of the monoclinic–tetragonal phase transformation
(DG monoc-tetr ) is plotted for comparison.
0
2
4
6
8
10
particle diameter [nm]
0
1
2
3
4
5
6
surface
energy
difference
tetragonal–monoclinc
[kJmol
-1
]
ΔG monoc-tetr
Figure 3.12 Differences in surface energy of the monoclinic and tetragonal phases as a function
of particle size in comparison to the free enthalpy of the monoclinic–tetragonal phase
transformation DG monoc-tetr .
32j 3 Surfaces in Nanomaterials
shown graphically in Figure 3.11, for the case of zirconia. Again, a value of
1 J m
À2 was assumed for the surface energy.
It is clear from the data shown in Figure 3.11 that for particles smaller than 2 nm,
the surface energy is comparable to the energy of formation. The free enthalpy of the
monoclinic–tetragonal transformation is significantly less than the surface energy,
although in the latter case only the surface change during the phase transformation
should be considered (see Figure 3.12).
0
2
4
6
8
10
particle diameter [nm]
0
20
40
60
80
100
120
140
160
surface
energy
[kJmol
-1 ]
ΔG ZrO 2
ΔG monoc-tetr
Figure 3.11 Surface energy of zirconia particles as a function of grain size. The free enthalpy of
formation (DG ZrO2 ) and the free enthalpy of the monoclinic–tetragonal phase transformation
(DG monoc-tetr ) is plotted for comparison.
0
2
4
6
8
10
particle diameter [nm]
0
1
2
3
4
5
6
surface
energy
difference
tetragonal–monoclinc
[kJmol
-1
]
ΔG monoc-tetr
Figure 3.12 Differences in surface energy of the monoclinic and tetragonal phases as a function
of particle size in comparison to the free enthalpy of the monoclinic–tetragonal phase
transformation DG monoc-tetr .
32j 3 Surfaces in Nanomaterials