

This example of coagulation is related directly to grain growth during sintering
where, in general, a dramatic grain growth is observed. Such growth leads to a
reduction in surface energy and hence to a reduction in free energy. It is possible to
estimate the energy released during the sintering of nanoparticles in connection
with grain growth. Assuming spherical particles with an initial grain size d
and (after growth) a final grain size of d final , then due to the reduction of the
surface the energy U per mole is released. U is given by U ¼ c nA À A final
ð
Þ M=rv final
with n ¼ v final =v ¼ d final =d leading to:
U ¼
M
r
6c
d final
d final
d
À 1
ð3:7Þ
As long as d final /d ) 1, the surface energy released during grain growth is
proportional to the inverse particle size. The energy released per mole, again using
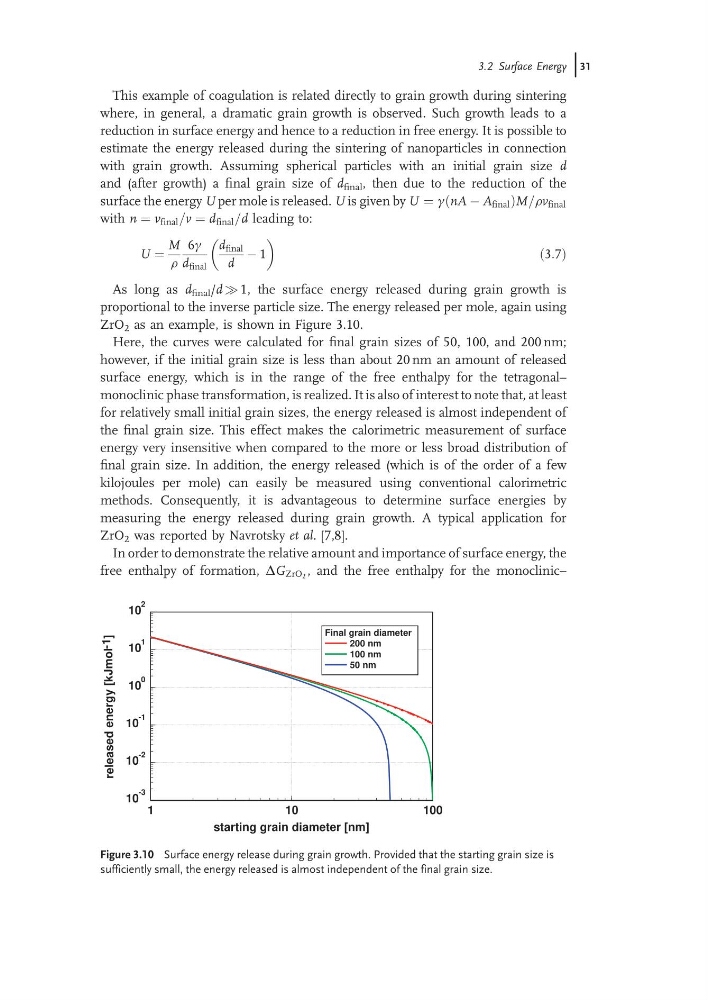
ZrO 2 as an example, is shown in Figure 3.10.
Here, the curves were calculated for final grain sizes of 50, 100, and 200 nm;
however, if the initial grain size is less than about 20 nm an amount of released
surface energy, which is in the range of the free enthalpy for the tetragonal–
monoclinic phase transformation, is realized. It is also of interest to note that, at least
for relatively small initial grain sizes, the energy released is almost independent of
the final grain size. This effect makes the calorimetric measurement of surface
energy very insensitive when compared to the more or less broad distribution of
final grain size. In addition, the energy released (which is of the order of a few
kilojoules per mole) can easily be measured using conventional calorimetric
methods. Consequently, it is advantageous to determine surface energies by
measuring the energy released during grain growth. A typical application for
ZrO 2 was reported by Navrotsky et al. [7,8].
In order to demonstrate the relative amount and importance of surface energy, the
free enthalpy of formation, DG ZrO2 , and the free enthalpy for the monoclinic–
1
10
100
starting grain diameter [nm]
10
-3
10
-2
10
-1
10
0
10
1
10
2
released
energy
[kJmol
-1 ]
Final grain diameter
200 nm
100 nm
50 nm
Figure 3.10 Surface energy release during grain growth. Provided that the starting grain size is
sufficiently small, the energy released is almost independent of the final grain size.
3.2 Surface Energy j31
where, in general, a dramatic grain growth is observed. Such growth leads to a
reduction in surface energy and hence to a reduction in free energy. It is possible to
estimate the energy released during the sintering of nanoparticles in connection
with grain growth. Assuming spherical particles with an initial grain size d
and (after growth) a final grain size of d final , then due to the reduction of the
surface the energy U per mole is released. U is given by U ¼ c nA À A final
ð
Þ M=rv final
with n ¼ v final =v ¼ d final =d leading to:
U ¼
M
r
6c
d final
d final
d
À 1
ð3:7Þ
As long as d final /d ) 1, the surface energy released during grain growth is
proportional to the inverse particle size. The energy released per mole, again using
ZrO 2 as an example, is shown in Figure 3.10.
Here, the curves were calculated for final grain sizes of 50, 100, and 200 nm;
however, if the initial grain size is less than about 20 nm an amount of released
surface energy, which is in the range of the free enthalpy for the tetragonal–
monoclinic phase transformation, is realized. It is also of interest to note that, at least
for relatively small initial grain sizes, the energy released is almost independent of
the final grain size. This effect makes the calorimetric measurement of surface
energy very insensitive when compared to the more or less broad distribution of
final grain size. In addition, the energy released (which is of the order of a few
kilojoules per mole) can easily be measured using conventional calorimetric
methods. Consequently, it is advantageous to determine surface energies by
measuring the energy released during grain growth. A typical application for
ZrO 2 was reported by Navrotsky et al. [7,8].
In order to demonstrate the relative amount and importance of surface energy, the
free enthalpy of formation, DG ZrO2 , and the free enthalpy for the monoclinic–
1
10
100
starting grain diameter [nm]
10
-3
10
-2
10
-1
10
0
10
1
10
2
released
energy
[kJmol
-1 ]
Final grain diameter
200 nm
100 nm
50 nm
Figure 3.10 Surface energy release during grain growth. Provided that the starting grain size is
sufficiently small, the energy released is almost independent of the final grain size.
3.2 Surface Energy j31