

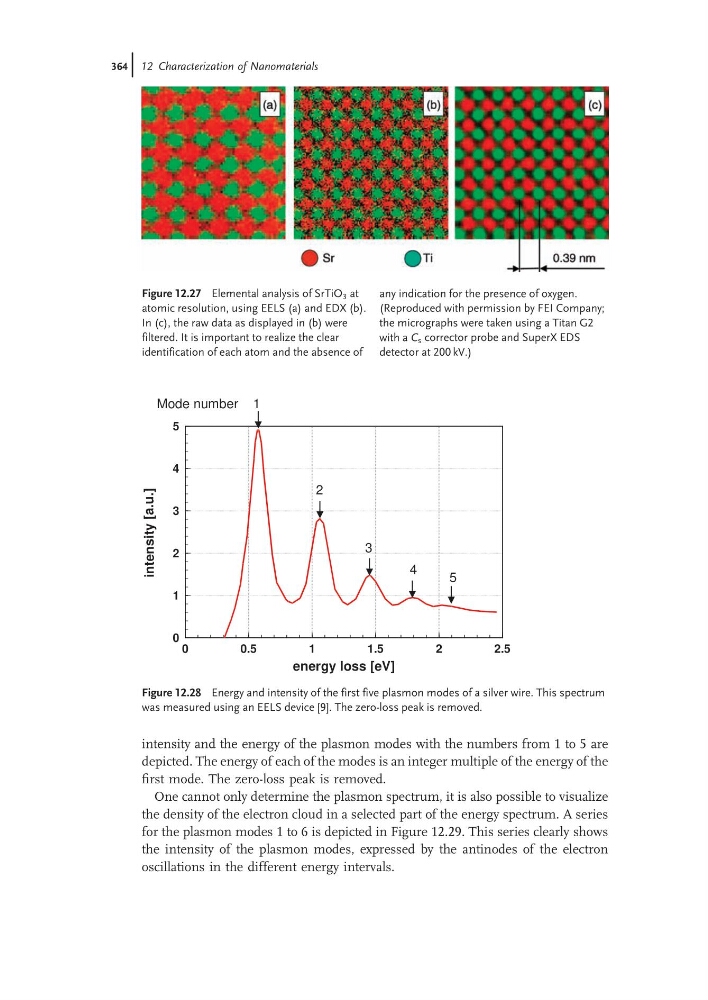
intensity and the energy of the plasmon modes with the numbers from 1 to 5 are
depicted. The energy of each of the modes is an integer multiple of the energy of the
first mode. The zero-loss peak is removed.
One cannot only determine the plasmon spectrum, it is also possible to visualize
the density of the electron cloud in a selected part of the energy spectrum. A series
for the plasmon modes 1 to 6 is depicted in Figure 12.29. This series clearly shows
the intensity of the plasmon modes, expressed by the antinodes of the electron
oscillations in the different energy intervals.
Figure 12.27 Elemental analysis of SrTiO 3 at
atomic resolution, using EELS (a) and EDX (b).
In (c), the raw data as displayed in (b) were
filtered. It is important to realize the clear
identification of each atom and the absence of
any indication for the presence of oxygen.
(Reproduced with permission by FEI Company;
the micrographs were taken using a Titan G2
with a C s corrector probe and SuperX EDS
detector at 200 kV.)
0
0.5
1
1.5
2
2.5
energy loss [eV]
0
1
2
3
4
5
intensity
[a.u.]
Mode number 1
2
3
4
5
Figure 12.28 Energy and intensity of the first five plasmon modes of a silver wire. This spectrum
was measured using an EELS device [9]. The zero-loss peak is removed.
364j 12 Characterization of Nanomaterials
depicted. The energy of each of the modes is an integer multiple of the energy of the
first mode. The zero-loss peak is removed.
One cannot only determine the plasmon spectrum, it is also possible to visualize
the density of the electron cloud in a selected part of the energy spectrum. A series
for the plasmon modes 1 to 6 is depicted in Figure 12.29. This series clearly shows
the intensity of the plasmon modes, expressed by the antinodes of the electron
oscillations in the different energy intervals.
Figure 12.27 Elemental analysis of SrTiO 3 at
atomic resolution, using EELS (a) and EDX (b).
In (c), the raw data as displayed in (b) were
filtered. It is important to realize the clear
identification of each atom and the absence of
any indication for the presence of oxygen.
(Reproduced with permission by FEI Company;
the micrographs were taken using a Titan G2
with a C s corrector probe and SuperX EDS
detector at 200 kV.)
0
0.5
1
1.5
2
2.5
energy loss [eV]
0
1
2
3
4
5
intensity
[a.u.]
Mode number 1
2
3
4
5
Figure 12.28 Energy and intensity of the first five plasmon modes of a silver wire. This spectrum
was measured using an EELS device [9]. The zero-loss peak is removed.
364j 12 Characterization of Nanomaterials