

The next group of features in the EELS spectrum are the absorption edges, which
are specific for the elements in the specimen. On the side of higher energy losses
(ranging up to 50 eV from the absorption edge), these structures contain information on binding, symmetry, bond length, and coordination numbers. The EELS
spectrum shown in Figure 12.24 demonstrates only one absorption edge in the
range of low electron loss energies, but depending on the composition of the
specimen, absorption edges may also be found in the range of many kilo electron
volts. A typical spectrum of an absorption edge is shown in Figure 12.26, which
shows the K absorption edge of carbon with the background having already been
removed. These two spectra are for single- and multiwall carbon nanotubes. As in
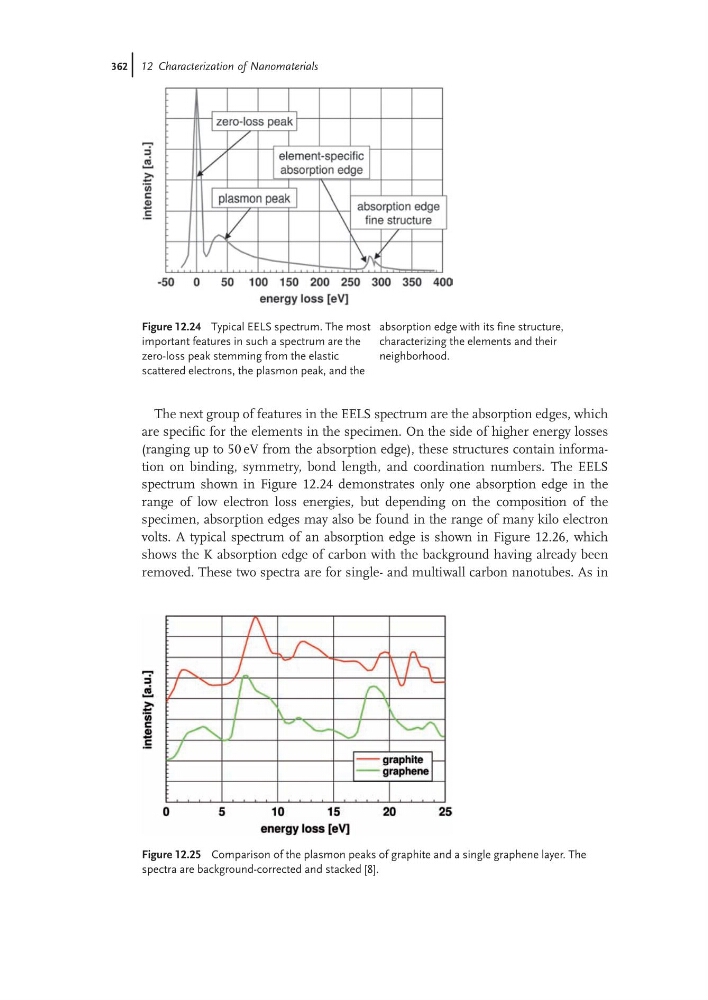
Figure 12.24 Typical EELS spectrum. The most
important features in such a spectrum are the
zero-loss peak stemming from the elastic
scattered electrons, the plasmon peak, and the
absorption edge with its fine structure,
characterizing the elements and their
neighborhood.
Figure 12.25 Comparison of the plasmon peaks of graphite and a single graphene layer. The
spectra are background-corrected and stacked [8].
362j 12 Characterization of Nanomaterials
are specific for the elements in the specimen. On the side of higher energy losses
(ranging up to 50 eV from the absorption edge), these structures contain information on binding, symmetry, bond length, and coordination numbers. The EELS
spectrum shown in Figure 12.24 demonstrates only one absorption edge in the
range of low electron loss energies, but depending on the composition of the
specimen, absorption edges may also be found in the range of many kilo electron
volts. A typical spectrum of an absorption edge is shown in Figure 12.26, which
shows the K absorption edge of carbon with the background having already been
removed. These two spectra are for single- and multiwall carbon nanotubes. As in
Figure 12.24 Typical EELS spectrum. The most
important features in such a spectrum are the
zero-loss peak stemming from the elastic
scattered electrons, the plasmon peak, and the
absorption edge with its fine structure,
characterizing the elements and their
neighborhood.
Figure 12.25 Comparison of the plasmon peaks of graphite and a single graphene layer. The
spectra are background-corrected and stacked [8].
362j 12 Characterization of Nanomaterials