

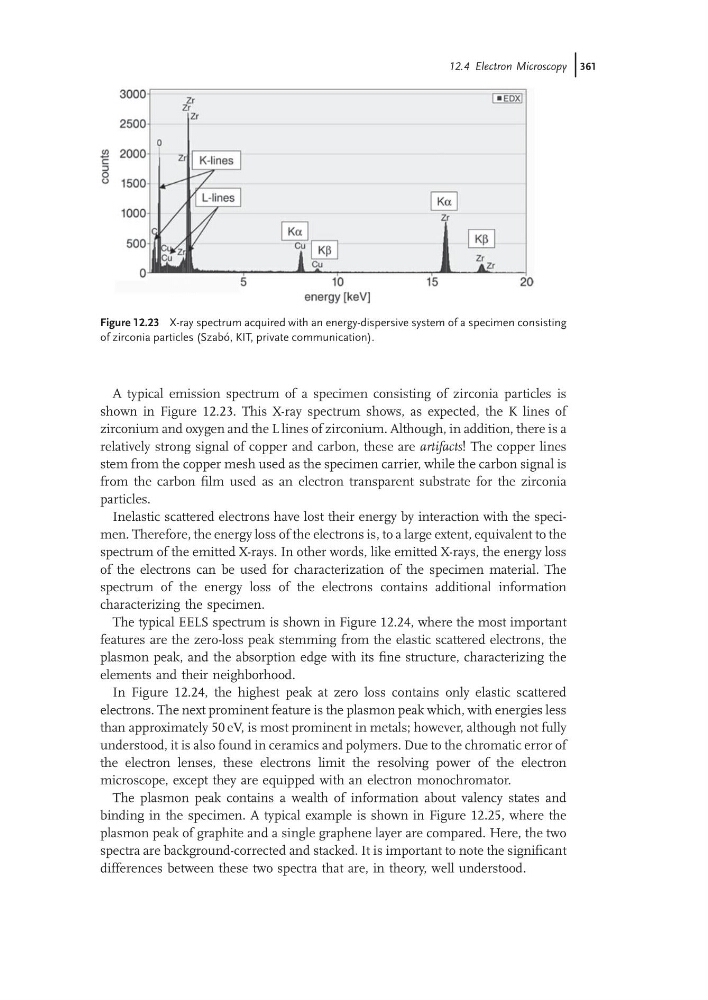
A typical emission spectrum of a specimen consisting of zirconia particles is
shown in Figure 12.23. This X-ray spectrum shows, as expected, the K lines of
zirconium and oxygen and the L lines of zirconium. Although, in addition, there is a
relatively strong signal of copper and carbon, these are artifacts! The copper lines
stem from the copper mesh used as the specimen carrier, while the carbon signal is
from the carbon film used as an electron transparent substrate for the zirconia
particles.
Inelastic scattered electrons have lost their energy by interaction with the specimen. Therefore, the energy loss of the electrons is, to a large extent, equivalent to the
spectrum of the emitted X-rays. In other words, like emitted X-rays, the energy loss
of the electrons can be used for characterization of the specimen material. The
spectrum of the energy loss of the electrons contains additional information
characterizing the specimen.
The typical EELS spectrum is shown in Figure 12.24, where the most important
features are the zero-loss peak stemming from the elastic scattered electrons, the
plasmon peak, and the absorption edge with its fine structure, characterizing the
elements and their neighborhood.
In Figure 12.24, the highest peak at zero loss contains only elastic scattered
electrons. The next prominent feature is the plasmon peak which, with energies less
than approximately 50 eV, is most prominent in metals; however, although not fully
understood, it is also found in ceramics and polymers. Due to the chromatic error of
the electron lenses, these electrons limit the resolving power of the electron
microscope, except they are equipped with an electron monochromator.
The plasmon peak contains a wealth of information about valency states and
binding in the specimen. A typical example is shown in Figure 12.25, where the
plasmon peak of graphite and a single graphene layer are compared. Here, the two
spectra are background-corrected and stacked. It is important to note the significant
differences between these two spectra that are, in theory, well understood.
Figure 12.23 X-ray spectrum acquired with an energy-dispersive system of a specimen consisting
of zirconia particles (Szab o, KIT, private communication).
12.4 Electron Microscopy j361
shown in Figure 12.23. This X-ray spectrum shows, as expected, the K lines of
zirconium and oxygen and the L lines of zirconium. Although, in addition, there is a
relatively strong signal of copper and carbon, these are artifacts! The copper lines
stem from the copper mesh used as the specimen carrier, while the carbon signal is
from the carbon film used as an electron transparent substrate for the zirconia
particles.
Inelastic scattered electrons have lost their energy by interaction with the specimen. Therefore, the energy loss of the electrons is, to a large extent, equivalent to the
spectrum of the emitted X-rays. In other words, like emitted X-rays, the energy loss
of the electrons can be used for characterization of the specimen material. The
spectrum of the energy loss of the electrons contains additional information
characterizing the specimen.
The typical EELS spectrum is shown in Figure 12.24, where the most important
features are the zero-loss peak stemming from the elastic scattered electrons, the
plasmon peak, and the absorption edge with its fine structure, characterizing the
elements and their neighborhood.
In Figure 12.24, the highest peak at zero loss contains only elastic scattered
electrons. The next prominent feature is the plasmon peak which, with energies less
than approximately 50 eV, is most prominent in metals; however, although not fully
understood, it is also found in ceramics and polymers. Due to the chromatic error of
the electron lenses, these electrons limit the resolving power of the electron
microscope, except they are equipped with an electron monochromator.
The plasmon peak contains a wealth of information about valency states and
binding in the specimen. A typical example is shown in Figure 12.25, where the
plasmon peak of graphite and a single graphene layer are compared. Here, the two
spectra are background-corrected and stacked. It is important to note the significant
differences between these two spectra that are, in theory, well understood.
Figure 12.23 X-ray spectrum acquired with an energy-dispersive system of a specimen consisting
of zirconia particles (Szab o, KIT, private communication).
12.4 Electron Microscopy j361