

is fulfilled. Simple calculations show that maximal resolution goes with cot q. In
other words: one obtains maximal resolution by selecting experimental conditions
leading to a diffraction angle close to 180
or p. As in electron diffraction, the
diffraction angles usually are extremely small; this must be interpreted as
instruction to seek diffraction lines at the maximum possible diffraction angle
q. According to Eq. (12.17), this corresponds to lattice planes with small values of
d, although it must be borne in mind that the intensity of diffraction lines at
higher angles, usually, is very small. This creates, especially in the case of
nanoparticles, severe problems as the diffraction patterns of small particles
usually are connected to low intensities.
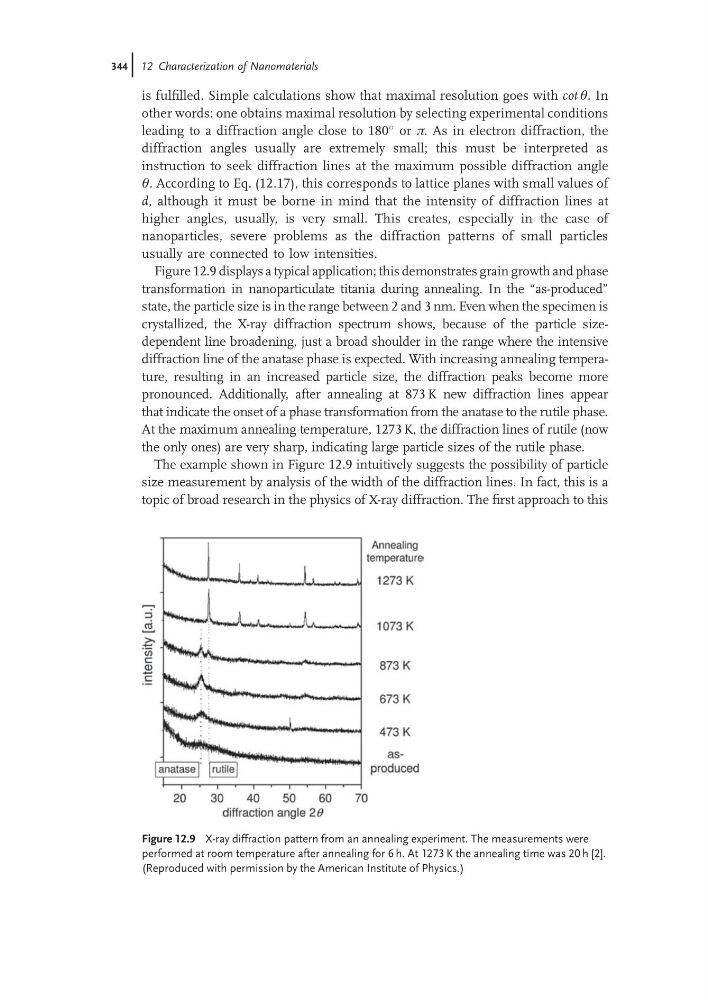
Figure 12.9 displays a typical application; this demonstrates grain growth and phase
transformation in nanoparticulate titania during annealing. In the “as-produced”
state, the particle size is in the range between 2 and 3 nm. Even when the specimen is
crystallized, the X-ray diffraction spectrum shows, because of the particle sizedependent line broadening, just a broad shoulder in the range where the intensive
diffraction line of the anatase phase is expected. With increasing annealing temperature, resulting in an increased particle size, the diffraction peaks become more
pronounced. Additionally, after annealing at 873 K new diffraction lines appear
that indicate the onset of a phase transformation from the anatase to the rutile phase.
At the maximum annealing temperature, 1273 K, the diffraction lines of rutile (now
the only ones) are very sharp, indicating large particle sizes of the rutile phase.
The example shown in Figure 12.9 intuitively suggests the possibility of particle
size measurement by analysis of the width of the diffraction lines. In fact, this is a
topic of broad research in the physics of X-ray diffraction. The first approach to this
Figure 12.9 X-ray diffraction pattern from an annealing experiment. The measurements were
performed at room temperature after annealing for 6 h. At 1273 K the annealing time was 20 h [2].
(Reproduced with permission by the American Institute of Physics.)
344j 12 Characterization of Nanomaterials
other words: one obtains maximal resolution by selecting experimental conditions
leading to a diffraction angle close to 180
or p. As in electron diffraction, the
diffraction angles usually are extremely small; this must be interpreted as
instruction to seek diffraction lines at the maximum possible diffraction angle
q. According to Eq. (12.17), this corresponds to lattice planes with small values of
d, although it must be borne in mind that the intensity of diffraction lines at
higher angles, usually, is very small. This creates, especially in the case of
nanoparticles, severe problems as the diffraction patterns of small particles
usually are connected to low intensities.
Figure 12.9 displays a typical application; this demonstrates grain growth and phase
transformation in nanoparticulate titania during annealing. In the “as-produced”
state, the particle size is in the range between 2 and 3 nm. Even when the specimen is
crystallized, the X-ray diffraction spectrum shows, because of the particle sizedependent line broadening, just a broad shoulder in the range where the intensive
diffraction line of the anatase phase is expected. With increasing annealing temperature, resulting in an increased particle size, the diffraction peaks become more
pronounced. Additionally, after annealing at 873 K new diffraction lines appear
that indicate the onset of a phase transformation from the anatase to the rutile phase.
At the maximum annealing temperature, 1273 K, the diffraction lines of rutile (now
the only ones) are very sharp, indicating large particle sizes of the rutile phase.
The example shown in Figure 12.9 intuitively suggests the possibility of particle
size measurement by analysis of the width of the diffraction lines. In fact, this is a
topic of broad research in the physics of X-ray diffraction. The first approach to this
Figure 12.9 X-ray diffraction pattern from an annealing experiment. The measurements were
performed at room temperature after annealing for 6 h. At 1273 K the annealing time was 20 h [2].
(Reproduced with permission by the American Institute of Physics.)
344j 12 Characterization of Nanomaterials