

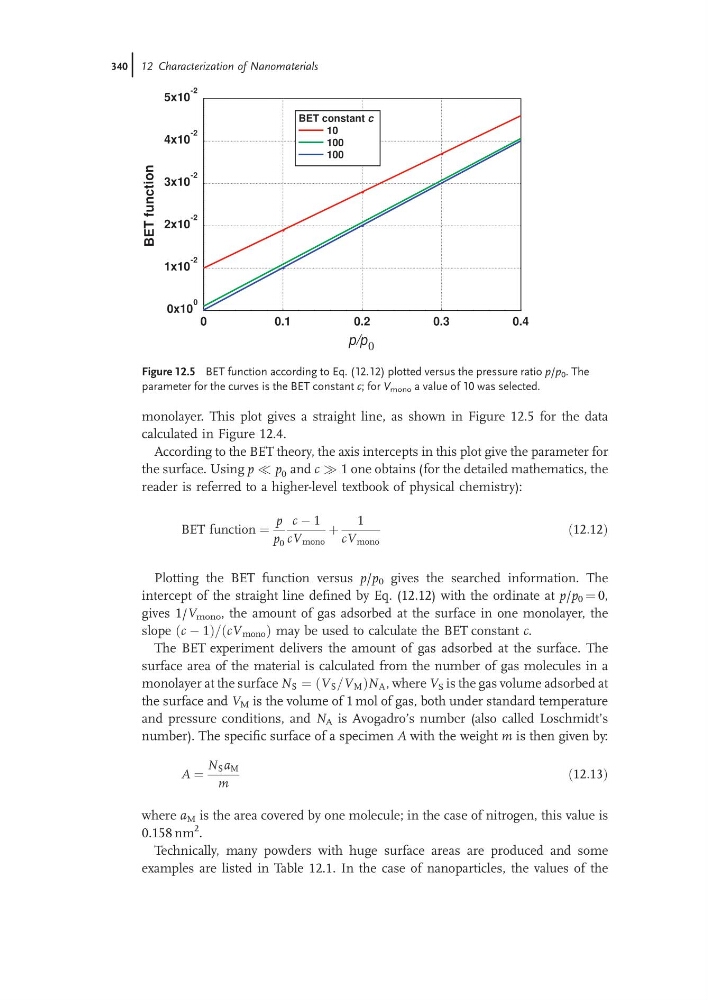
monolayer. This plot gives a straight line, as shown in Figure 12.5 for the data
calculated in Figure 12.4.
According to the BET theory, the axis intercepts in this plot give the parameter for
the surface. Using p ( p 0 and c ) 1 one obtains (for the detailed mathematics, the
reader is referred to a higher-level textbook of physical chemistry):
BET function ¼
p
p 0
c À 1
cV mono
þ
1
cV mono
ð12:12Þ
Plotting the BET function versus p/p 0 gives the searched information. The
intercept of the straight line defined by Eq. (12.12) with the ordinate at p/p 0 ¼ 0,
gives 1/V mono , the amount of gas adsorbed at the surface in one monolayer, the
slope ðc À 1Þ=ðcV mono Þ may be used to calculate the BET constant c.
The BET experiment delivers the amount of gas adsorbed at the surface. The
surface area of the material is calculated from the number of gas molecules in a
monolayer at the surface N S ¼ ðV S =V M ÞN A , where V S is the gas volume adsorbed at
the surface and V M is the volume of 1 mol of gas, both under standard temperature
and pressure conditions, and N A is Avogadro’s number (also called Loschmidt’s
number). The specific surface of a specimen A with the weight m is then given by:
A ¼
N S a M
m
ð12:13Þ
where a M is the area covered by one molecule; in the case of nitrogen, this value is
0.158 nm
2 .
Technically, many powders with huge surface areas are produced and some
examples are listed in Table 12.1. In the case of nanoparticles, the values of the
0
0.1
0.2
0.3
0.4
p/p 0
0x10
0
1x10
-2
2x10
-2
3x10
-2
4x10
-2
5x10
-2
BET
function
BET constant c
10
100
100
Figure 12.5 BET function according to Eq. (12.12) plotted versus the pressure ratio p/p 0 . The
parameter for the curves is the BET constant c; for V mono a value of 10 was selected.
340j 12 Characterization of Nanomaterials
calculated in Figure 12.4.
According to the BET theory, the axis intercepts in this plot give the parameter for
the surface. Using p ( p 0 and c ) 1 one obtains (for the detailed mathematics, the
reader is referred to a higher-level textbook of physical chemistry):
BET function ¼
p
p 0
c À 1
cV mono
þ
1
cV mono
ð12:12Þ
Plotting the BET function versus p/p 0 gives the searched information. The
intercept of the straight line defined by Eq. (12.12) with the ordinate at p/p 0 ¼ 0,
gives 1/V mono , the amount of gas adsorbed at the surface in one monolayer, the
slope ðc À 1Þ=ðcV mono Þ may be used to calculate the BET constant c.
The BET experiment delivers the amount of gas adsorbed at the surface. The
surface area of the material is calculated from the number of gas molecules in a
monolayer at the surface N S ¼ ðV S =V M ÞN A , where V S is the gas volume adsorbed at
the surface and V M is the volume of 1 mol of gas, both under standard temperature
and pressure conditions, and N A is Avogadro’s number (also called Loschmidt’s
number). The specific surface of a specimen A with the weight m is then given by:
A ¼
N S a M
m
ð12:13Þ
where a M is the area covered by one molecule; in the case of nitrogen, this value is
0.158 nm
2 .
Technically, many powders with huge surface areas are produced and some
examples are listed in Table 12.1. In the case of nanoparticles, the values of the
0
0.1
0.2
0.3
0.4
p/p 0
0x10
0
1x10
-2
2x10
-2
3x10
-2
4x10
-2
5x10
-2
BET
function
BET constant c
10
100
100
Figure 12.5 BET function according to Eq. (12.12) plotted versus the pressure ratio p/p 0 . The
parameter for the curves is the BET constant c; for V mono a value of 10 was selected.
340j 12 Characterization of Nanomaterials