

specific surface areas range from 45 to 400 m
2 g
À1 . However, in interpreting these
values great care must be taken as they are related to a constant weight and not to a
certain volume of material. Values of the surface per square centimeter are listed in
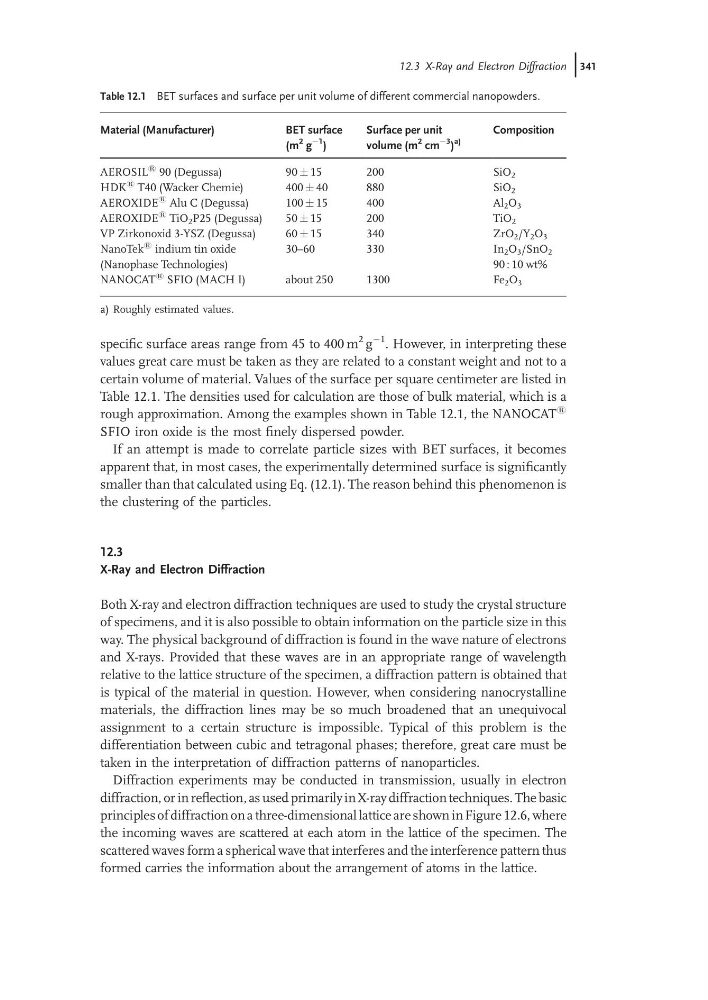
Table 12.1. The densities used for calculation are those of bulk material, which is a
rough approximation. Among the examples shown in Table 12.1, the NANOCAT
1
SFIO iron oxide is the most finely dispersed powder.
If an attempt is made to correlate particle sizes with BET surfaces, it becomes
apparent that, in most cases, the experimentally determined surface is significantly
smaller than that calculated using Eq. (12.1). The reason behind this phenomenon is
the clustering of the particles.
12.3
X-Ray and Electron Diffraction
Both X-ray and electron diffraction techniques are used to study the crystal structure
of specimens, and it is also possible to obtain information on the particle size in this
way. The physical background of diffraction is found in the wave nature of electrons
and X-rays. Provided that these waves are in an appropriate range of wavelength
relative to the lattice structure of the specimen, a diffraction pattern is obtained that
is typical of the material in question. However, when considering nanocrystalline
materials, the diffraction lines may be so much broadened that an unequivocal
assignment to a certain structure is impossible. Typical of this problem is the
differentiation between cubic and tetragonal phases; therefore, great care must be
taken in the interpretation of diffraction patterns of nanoparticles.
Diffraction experiments may be conducted in transmission, usually in electron
diffraction, or in reflection, as used primarily in X-ray diffraction techniques. The basic
principles of diffraction on a three-dimensional lattice are shown in Figure 12.6, where
the incoming waves are scattered at each atom in the lattice of the specimen. The
scattered waves form a spherical wave that interferes and the interference pattern thus
formed carries the information about the arrangement of atoms in the lattice.
Table 12.1 BET surfaces and surface per unit volume of different commercial nanopowders.
Material (Manufacturer)
BET surface
(m
2 g
À1 )
Surface per unit
volume (m
2 cm
À3
)
a)
Composition
AEROSIL
1 90 (Degussa)
90 Æ 15
200
SiO 2
HDK
1 T40 (Wacker Chemie)
400 Æ 40
880
SiO 2
AEROXIDE
1 Alu C (Degussa)
100 Æ 15
400
Al 2 O 3
AEROXIDE
1 TiO 2 P25 (Degussa)
50 Æ 15
200
TiO 2
VP Zirkonoxid 3-YSZ (Degussa)
60 Æ 15
340
ZrO 2 /Y 2 O 3
NanoTek
1 indium tin oxide
(Nanophase Technologies)
30–60
330
In 2 O 3 /SnO 2
90 : 10 wt%
NANOCAT
1 SFIO (MACH I)
about 250
1300
Fe 2 O 3
a) Roughly estimated values.
12.3 X-Ray and Electron Diffraction j341
2 g
À1 . However, in interpreting these
values great care must be taken as they are related to a constant weight and not to a
certain volume of material. Values of the surface per square centimeter are listed in
Table 12.1. The densities used for calculation are those of bulk material, which is a
rough approximation. Among the examples shown in Table 12.1, the NANOCAT
1
SFIO iron oxide is the most finely dispersed powder.
If an attempt is made to correlate particle sizes with BET surfaces, it becomes
apparent that, in most cases, the experimentally determined surface is significantly
smaller than that calculated using Eq. (12.1). The reason behind this phenomenon is
the clustering of the particles.
12.3
X-Ray and Electron Diffraction
Both X-ray and electron diffraction techniques are used to study the crystal structure
of specimens, and it is also possible to obtain information on the particle size in this
way. The physical background of diffraction is found in the wave nature of electrons
and X-rays. Provided that these waves are in an appropriate range of wavelength
relative to the lattice structure of the specimen, a diffraction pattern is obtained that
is typical of the material in question. However, when considering nanocrystalline
materials, the diffraction lines may be so much broadened that an unequivocal
assignment to a certain structure is impossible. Typical of this problem is the
differentiation between cubic and tetragonal phases; therefore, great care must be
taken in the interpretation of diffraction patterns of nanoparticles.
Diffraction experiments may be conducted in transmission, usually in electron
diffraction, or in reflection, as used primarily in X-ray diffraction techniques. The basic
principles of diffraction on a three-dimensional lattice are shown in Figure 12.6, where
the incoming waves are scattered at each atom in the lattice of the specimen. The
scattered waves form a spherical wave that interferes and the interference pattern thus
formed carries the information about the arrangement of atoms in the lattice.
Table 12.1 BET surfaces and surface per unit volume of different commercial nanopowders.
Material (Manufacturer)
BET surface
(m
2 g
À1 )
Surface per unit
volume (m
2 cm
À3
)
a)
Composition
AEROSIL
1 90 (Degussa)
90 Æ 15
200
SiO 2
HDK
1 T40 (Wacker Chemie)
400 Æ 40
880
SiO 2
AEROXIDE
1 Alu C (Degussa)
100 Æ 15
400
Al 2 O 3
AEROXIDE
1 TiO 2 P25 (Degussa)
50 Æ 15
200
TiO 2
VP Zirkonoxid 3-YSZ (Degussa)
60 Æ 15
340
ZrO 2 /Y 2 O 3
NanoTek
1 indium tin oxide
(Nanophase Technologies)
30–60
330
In 2 O 3 /SnO 2
90 : 10 wt%
NANOCAT
1 SFIO (MACH I)
about 250
1300
Fe 2 O 3
a) Roughly estimated values.
12.3 X-Ray and Electron Diffraction j341