

therefore the filler particles acted as flaws. This is an interesting example of a
composite with minimal interfacial interaction between the matrix polymer and the
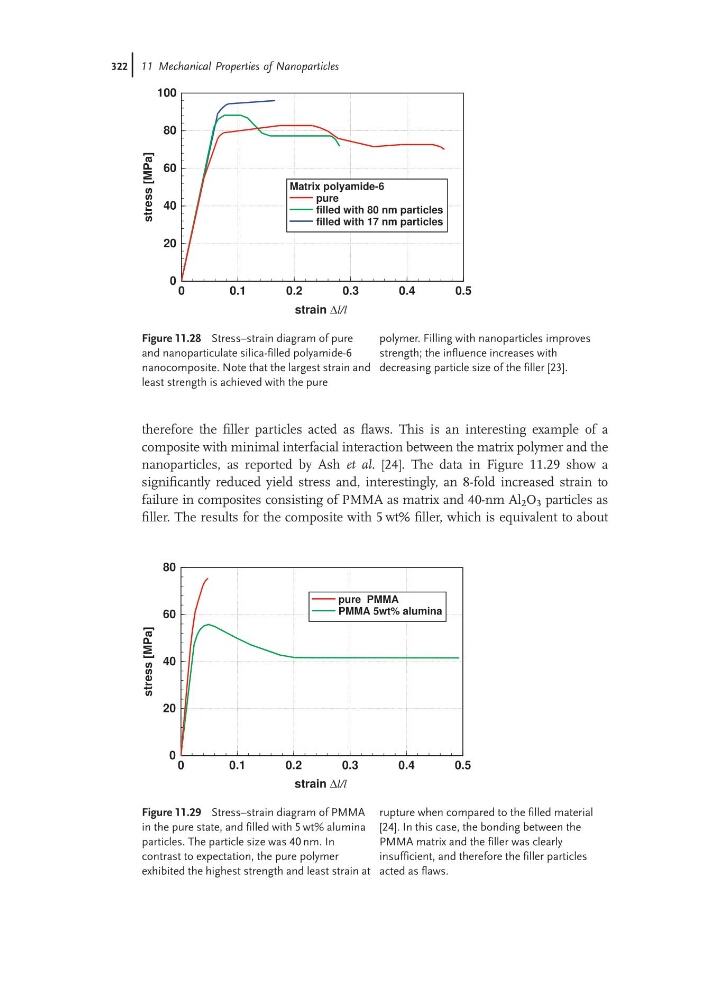
nanoparticles, as reported by Ash et al. [24]. The data in Figure 11.29 show a
significantly reduced yield stress and, interestingly, an 8-fold increased strain to
failure in composites consisting of PMMA as matrix and 40-nm Al 2 O 3 particles as
filler. The results for the composite with 5 wt% filler, which is equivalent to about
0
0.1
0.2
0.3
0.4
0.5
0
20
40
60
80
pure PMMA
PMMA 5wt% alumina
strain Δl/l
stress [MPa]
Figure 11.29 Stress–strain diagram of PMMA
in the pure state, and filled with 5 wt% alumina
particles. The particle size was 40 nm. In
contrast to expectation, the pure polymer
exhibited the highest strength and least strain at
rupture when compared to the filled material
[24]. In this case, the bonding between the
PMMA matrix and the filler was clearly
insufficient, and therefore the filler particles
acted as flaws.
0
0.1
0.2
0.3
0.4
0.5
0
20
40
60
80
100
Matrix polyamide-6
pure
filled with 80 nm particles
filled with 17 nm particles
strain Δl/l
stress [MPa]
Figure 11.28 Stress–strain diagram of pure
and nanoparticulate silica-filled polyamide-6
nanocomposite. Note that the largest strain and
least strength is achieved with the pure
polymer. Filling with nanoparticles improves
strength; the influence increases with
decreasing particle size of the filler [23].
322j 11 Mechanical Properties of Nanoparticles
composite with minimal interfacial interaction between the matrix polymer and the
nanoparticles, as reported by Ash et al. [24]. The data in Figure 11.29 show a
significantly reduced yield stress and, interestingly, an 8-fold increased strain to
failure in composites consisting of PMMA as matrix and 40-nm Al 2 O 3 particles as
filler. The results for the composite with 5 wt% filler, which is equivalent to about
0
0.1
0.2
0.3
0.4
0.5
0
20
40
60
80
pure PMMA
PMMA 5wt% alumina
strain Δl/l
stress [MPa]
Figure 11.29 Stress–strain diagram of PMMA
in the pure state, and filled with 5 wt% alumina
particles. The particle size was 40 nm. In
contrast to expectation, the pure polymer
exhibited the highest strength and least strain at
rupture when compared to the filled material
[24]. In this case, the bonding between the
PMMA matrix and the filler was clearly
insufficient, and therefore the filler particles
acted as flaws.
0
0.1
0.2
0.3
0.4
0.5
0
20
40
60
80
100
Matrix polyamide-6
pure
filled with 80 nm particles
filled with 17 nm particles
strain Δl/l
stress [MPa]
Figure 11.28 Stress–strain diagram of pure
and nanoparticulate silica-filled polyamide-6
nanocomposite. Note that the largest strain and
least strength is achieved with the pure
polymer. Filling with nanoparticles improves
strength; the influence increases with
decreasing particle size of the filler [23].
322j 11 Mechanical Properties of Nanoparticles